Sponge/USD ($SPONGE) Bounces at $0.000092
Estimated Reading Time: 3 minutes
Don’t invest unless you’re prepared to lose all the money you invest. This is a high-risk investment and you are unlikely to be protected if something goes wrong. Take 2 minutes to learn more

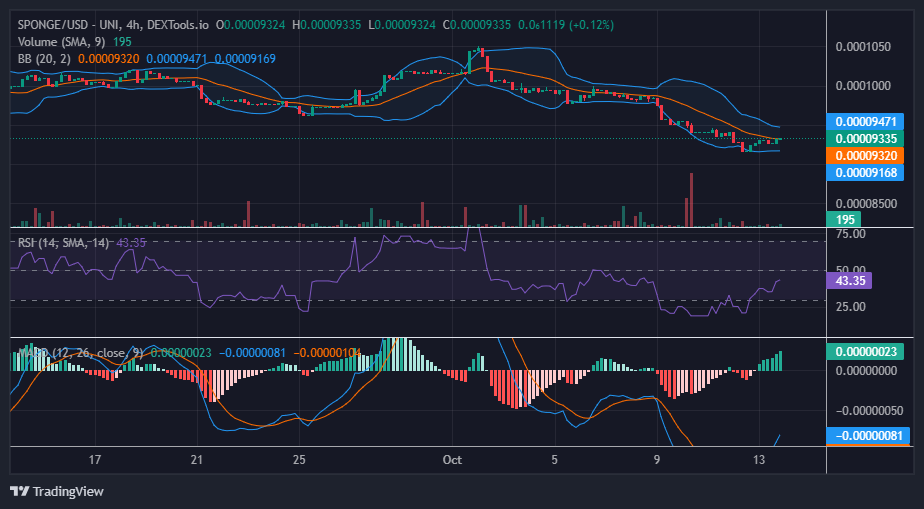
Bearish pressures have consistently exerted downward force on the $SPONGE market, driving it towards the critical $0.00009 price threshold. Although the market has spent a considerable period oscillating around the $0.0000988 price point, remaining in close proximity to the pivotal $0.00010 level, the unwavering bearish sentiment has compelled several fluctuations, progressively nearing the $0.00009 threshold. This juncture marks a potential turning point for a bullish recovery. Nevertheless, it’s noteworthy that a shift is occurring as the market appears to pivot at the $0.000092 level.
Key Levels
- Resistance: $0.000115, $0.000120, and $0.000125.
- Support: $0.000090, $0.000080, and $0.000085.
Sponge (SPONGE/USD) Price Analysis: Insights from Technical Indicators
Based on current indicators, the $SPONGE market is poised for a potential rebound, given its oversold condition. However, the bear market continues to exhibit resilience. The bull market appears to be in a struggle to counteract the prevailing bearish pressure. Nonetheless, the Relative Strength Index (RSI) offers a glimmer of optimism amidst the relentless bearish sentiment, indicating a forthcoming weakening of the bearish pressure.
The RSI’s upward movement, recovering from the sub-30 oversold threshold, suggests a growing influx of buying interest and the development of positive momentum in the market. This is interpreted as a bullish signal, signaling a possible wane in the recent downtrend and the initiation of a reversal.
$SPONGE Short-Term Outlook: 1-Hour Chart
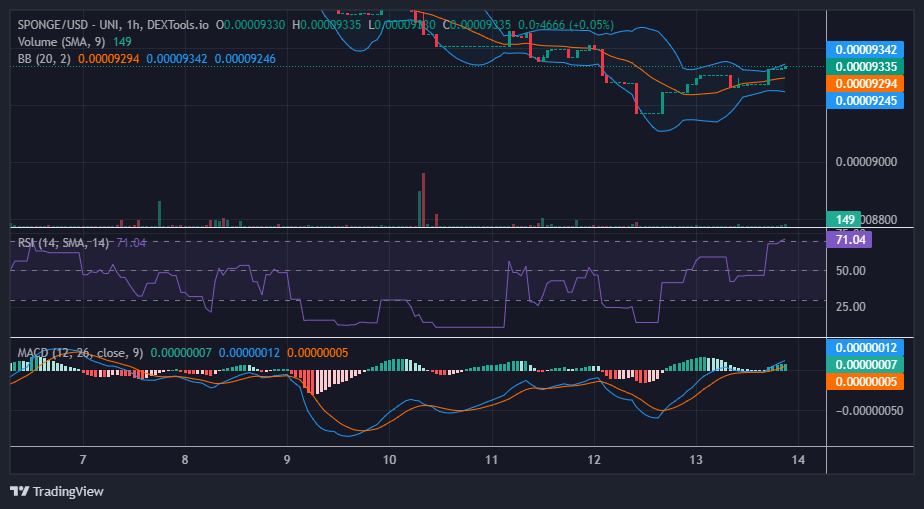
Upon examining the 1-hour chart, it becomes evident that the market is encountering several resistance levels. At its current valuation of $0.000093, the market is demonstrating a breakout from these resistance levels. This breakout is reinforced by the recent emergence of bullish candlesticks, indicative of heightened liquidity within the bull market.
Additionally, the expansion of the Bollinger Bands aligns with the market’s recovery. This may present an opportune moment to contemplate initiating a long trade with the aim of maximizing profit potential. There’s potential for the bull market to drive the price to $0.00010.
Season 1 of the $SPONGE airdrop is almost ended.
Don’t forget, #SPONGERS! 🧽 $SPONGE Airdrop Season 1 is almost over! 👀
📅 Entries open until Oct 30th
🎉 Winners selected on Nov 1st🔗 Learn how to enter below:https://t.co/lzRhjW4oLL#SPONGE #Web3 #Crypto #Alts pic.twitter.com/mh1wcpO6cV
— $SPONGE (@spongeoneth) October 13, 2023
Invest in the hottest and best meme coin. Buy Sponge ($SPONGE) today!