Cardano (ADA) Pushes on the Upside; Can Bulls Overcome $2.20 Resistance?
Estimated Reading Time: 2 minutes
Don’t invest unless you’re prepared to lose all the money you invest. This is a high-risk investment and you are unlikely to be protected if something goes wrong. Take 2 minutes to learn more
Cardano (ADA) Long-Term Analysis: Bearish
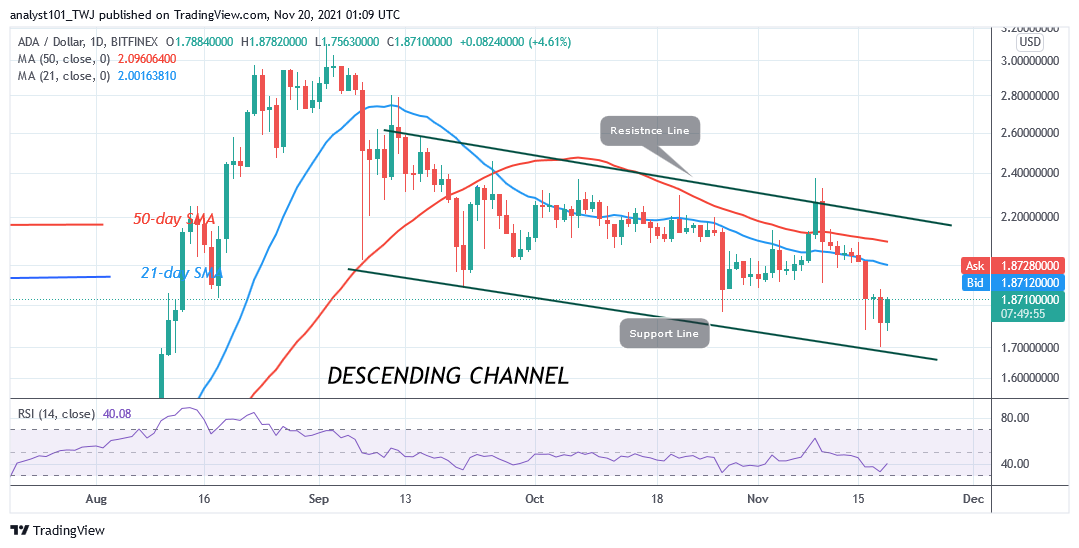
Cardano’s (ADA) price is in a downward move as price dropped to $1.70 low. The bulls bought the dips as the market resumes an upward move. The current selling pressure has subsided as the market resumes an upward move. Buyers have to push Cardano above $2.20 for the altcoin to be out of the downward correction. The current upward move is likely to face resistance at the $2.00 high.
Cardano (ADA) Indicator Analysis
The altcoin is at level 40 of the Relative Strength Index period 14. The cryptocurrency is in the downtrend zone and below the centerline 50. The 21-day SMA and the 50-day SMA are sloping downward indicating the downtrend. The market is above the 80% range of daily stochastic. It indicates that the altcoin is in a bullish momentum. Also, it approaches the overbought region of the market.
Technical indicators:
Major supply zones: $2.0, $2.20, $2.40
Major demand zones: $1.40, $1.20, $1.00
What Is the Next Direction for Cardano (ADA)?
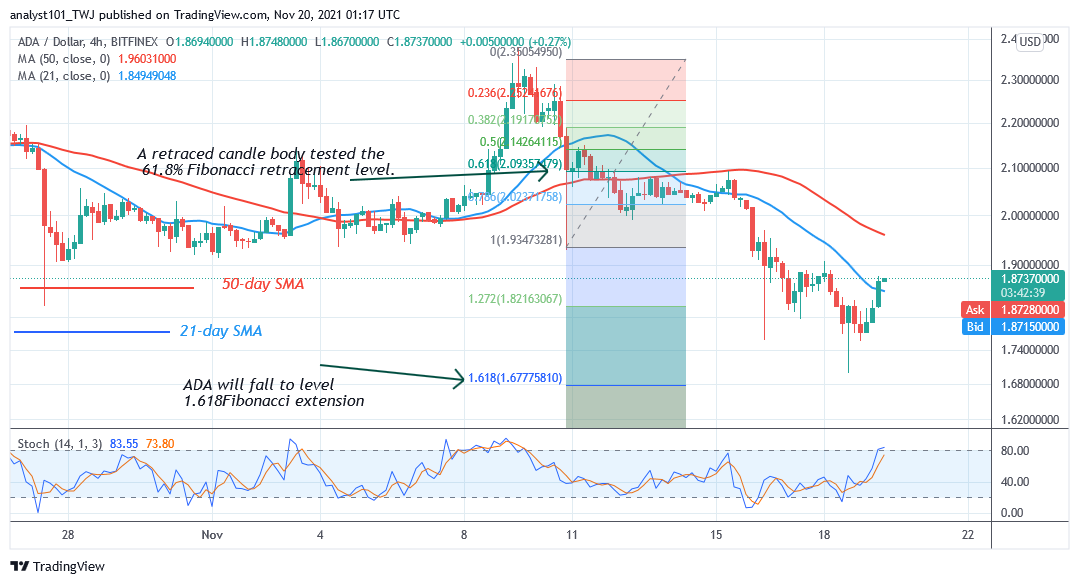
Cardano was earlier in a downward move. The trend has changed as the altcoin resumed its upward move. Meanwhile, on November 10 downtrend; a retraced candle body tested the 61.8% Fibonacci retracement level. The retracement indicates that Cardano will fall to level 1.618 Fibonacci extension or $1.67. From the price action, Cardano reached the low of $1.70 before resuming upward.
You can purchase crypto coins here. Buy Token
Note: Cryptosignals.org is not a financial advisor. Do your research before investing your funds in any financial asset or presented product or event. We are not responsible for your investing results