Cardano Hovers above $1.02 Support, Risks Further Decline to $0.77
Estimated Reading Time: 3 minutes
Don’t invest unless you’re prepared to lose all the money you invest. This is a high-risk investment and you are unlikely to be protected if something goes wrong. Take 2 minutes to learn more

Free Crypto Signals Channel
Cardano (ADA) Long-Term Analysis: Bullish
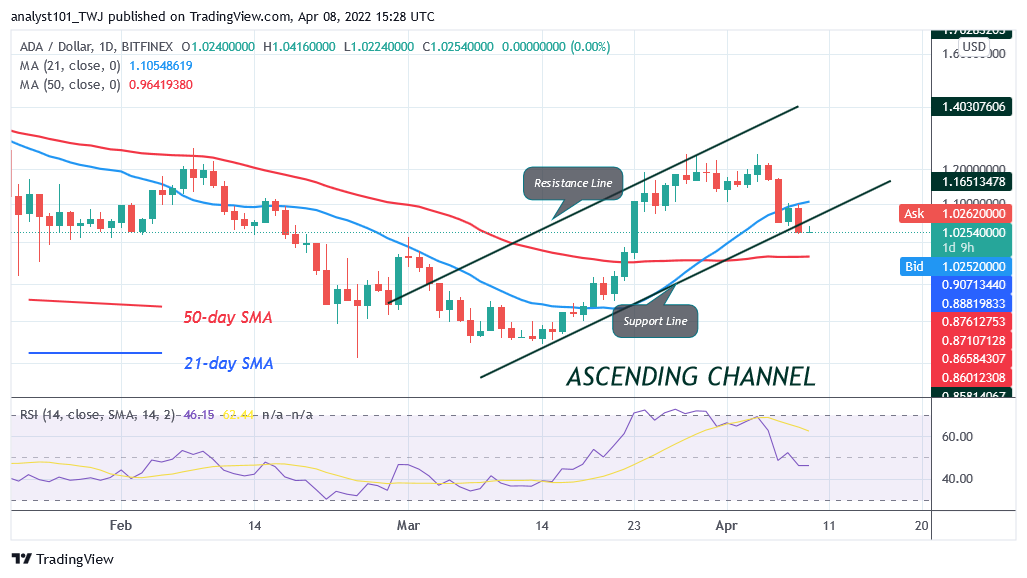
Cardano’s (ADA) price has fallen below the 21-day line moving average but risks further decline to $0.77. It fell below the 21-day line SMA but above the 50-day SMA. The implication is that the cryptocurrency will fluctuate between the moving averages. Today, Cardano is trading at $1.02 at the time of writing. On the downside, if the bears break below the $1.00 support or the 50-day line SMA, the market will decline to $0.77 low. On the other hand, if the 50-day line SMA support holds, ADA will rise to revisit the previous highs. A break above the 21-day line SMA will propel the coin to resume upside momentum.
Cardano (ADA) Indicator Analysis
The crypto’s price is between the 21-day line and 50-day line SMAs indicating that the altcoin will fluctuate between the moving averages. Cardano has fallen to level 46 of the Relative Strength Index for period 14. ADA price is in the bearish trend zone and capable of falling to the previous lows. ADA has fallen below the 20% range of daily stochastic. The altcoin has reached the oversold region of the market. The current selling pressure is likely to subside. Later buyers will emerge in the oversold region to push prices up.
Technical indicators:
Major supply zones: $2.0, $2.20, $2.40
Major demand zones: $1.40, $1.20, $1.00
What Is the Next Direction for Cardano (ADA)?
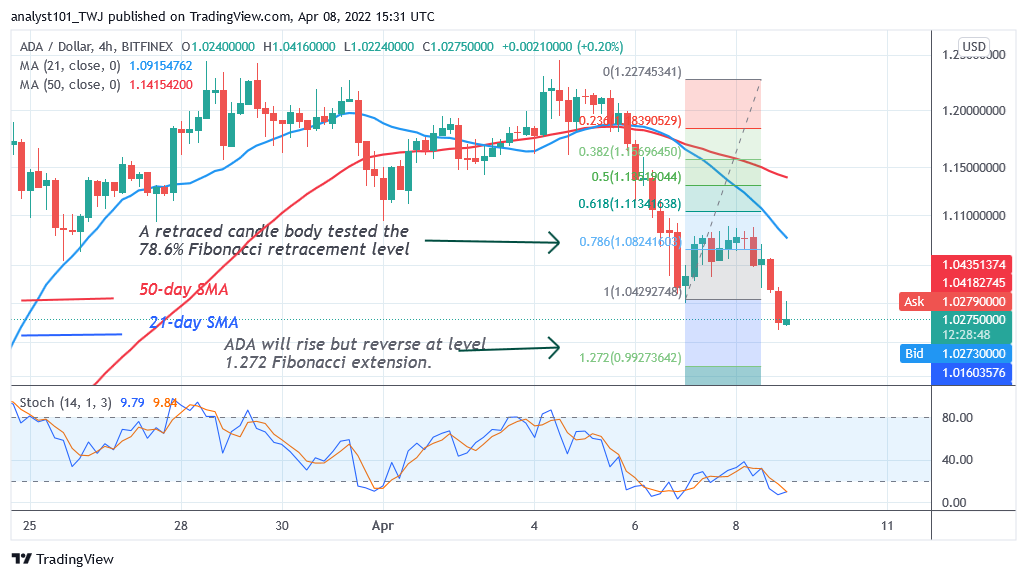
ADA/USD is in a downtrend as price breaks below the moving averages but risks further decline to $0.77. The selling pressure has reached the oversold region of the market. Cardano is likely to resume upward. Meanwhile, on April 6 uptrend; a retraced candle body tested the 78.6% Fibonacci retracement level. The retracement suggests that ADA will rise but reverse at level 1.272 Fibonacci extension or $0.99. From the price action, ADA is hovering above the $1.02 support.
You can purchase crypto coins here. Buy LBlock
Note: Cryptosignals.org is not a financial advisor. Do your research before investing your funds in any financial asset or presented product or event. We are not responsible for your investing results


