Arbitrum (ARB): Price Upward Trend, Room for Further Growth
Estimated Reading Time: 3 minutes
Don’t invest unless you’re prepared to lose all the money you invest. This is a high-risk investment and you are unlikely to be protected if something goes wrong. Take 2 minutes to learn more

Arbitrum (ARB) Technical Analysis – July 20
Arbitrum (ARB) is enjoying a positive trend, currently priced at $0.7764, reflecting a 4.80% increase over the last 24 hours. With a trading volume of $98,898,517, 127,588,421 ARB coins were exchanged in the past day.
Starting the day at $0.7748, Arbitrum has seen a slight rise of 0.05% from the opening price. The token surged to $0.7946 but encountered resistance, preventing further upward momentum.
Over the last 30 days, Arbitrum’s price has decreased by 8.62%, and by 0.34% over the past week. However, it is up by 33.99% from its lowest point in the last month and by 12.17% from its lowest point in the last week.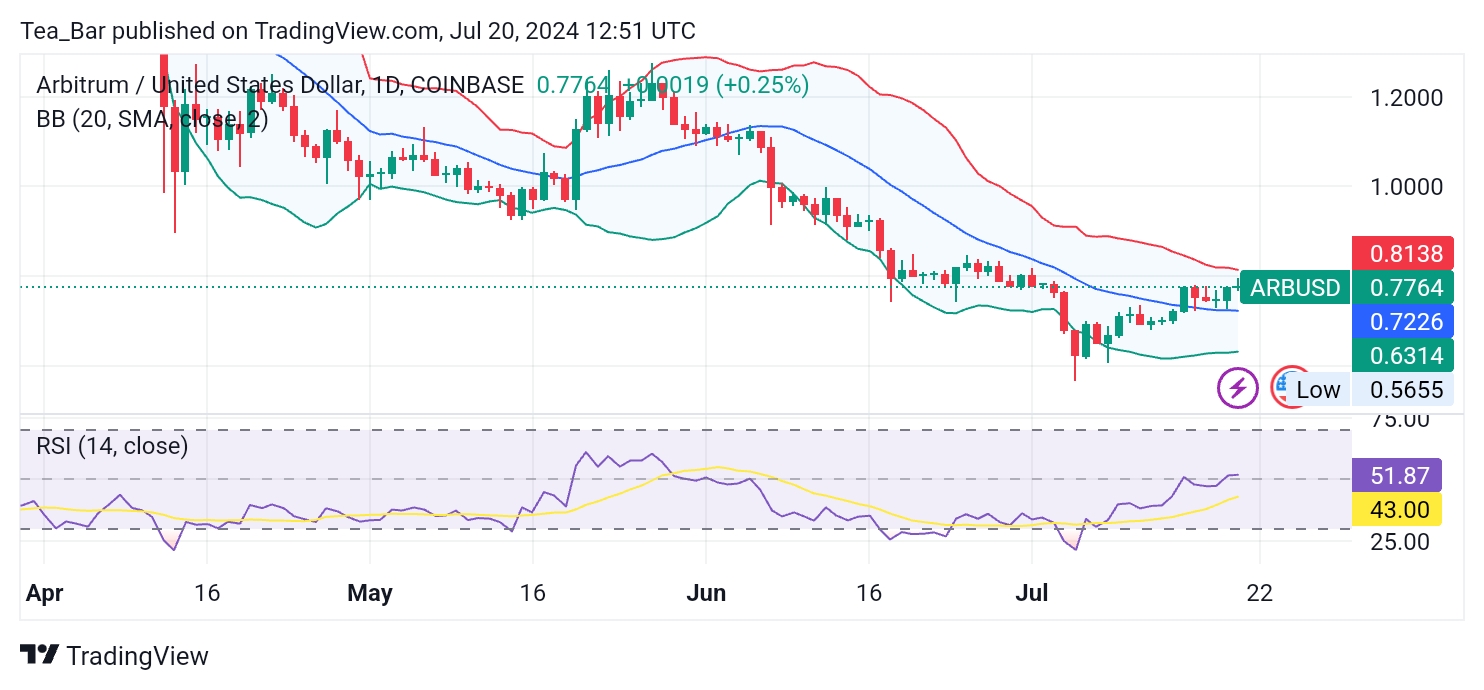
1-Day Chart Analysis
The daily Bollinger Bands for Arbitrum show a potential for further upward movement. The upper band is at $0.8138, the middle band at $0.7226, and the lower band at $0.6314. Arbitrum’s current price is near the middle Bollinger Band, suggesting a balanced market condition with room for growth.
The 14-day RSI (Relative Strength Index) is at 43, indicating that the token is neither overbought nor oversold, presenting a stable outlook.
4-Hour Chart Analysis
On the 4-hour chart, the Bollinger Bands are tighter, with the upper band at $0.7889, the middle band at $0.7580, and the lower band at $0.7271. Arbitrum’s price is approaching the upper band, indicating bullish momentum in the short term. 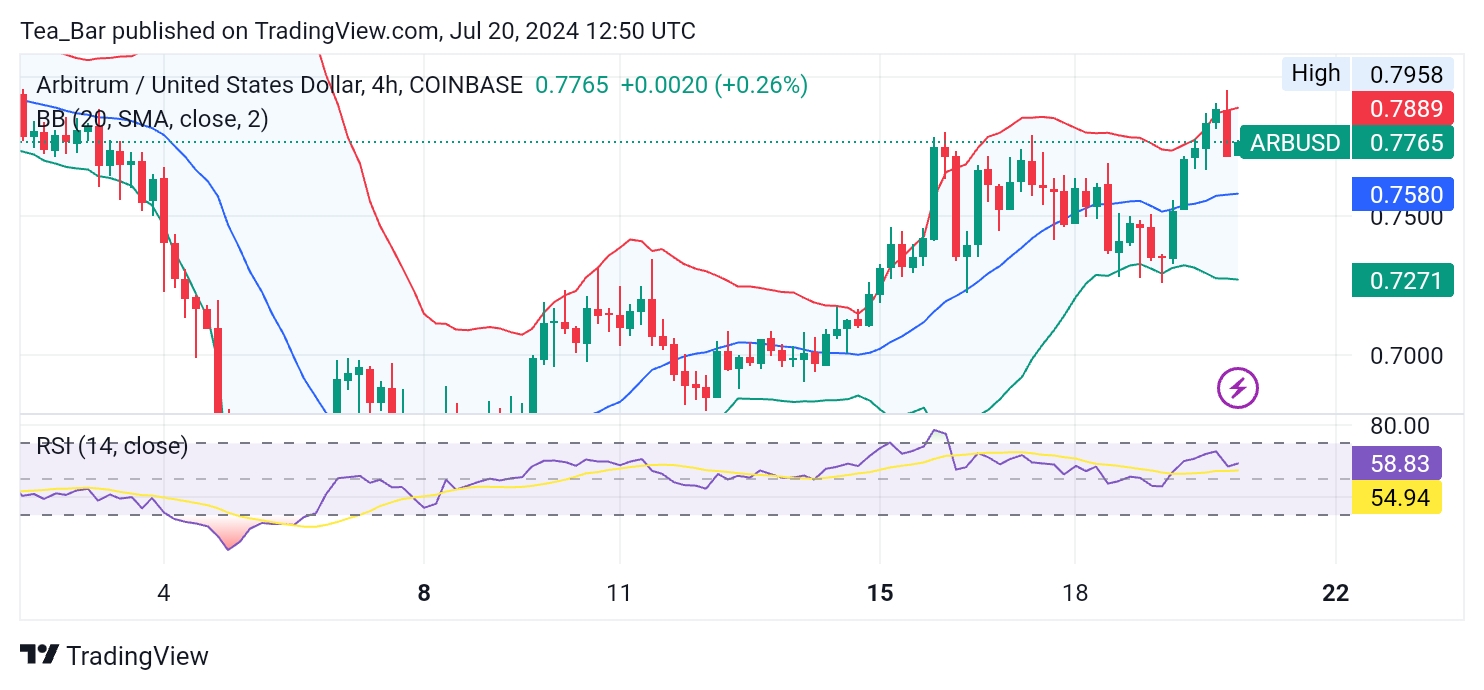
The RSI on this timeframe is at 54, which is in the neutral zone but leaning towards being overbought. This suggests positive investor sentiment and potential for further gains.
Conclusion
Arbitrum (ARB) is showing encouraging signs, with a significant increase over the past 24 hours and a stable outlook in both short and long-term analyses. The daily chart indicates room for growth, with the price near the middle Bollinger Band and a neutral RSI.
The 4-hour chart highlights short-term bullish momentum, as the price approaches the upper Bollinger Band and an RSI leaning towards overbought territory.
Key levels to watch include the upper Bollinger Bands on both charts ($0.8138 on the daily and $0.7889 on the 4-hour). Breaking above these levels could signal further upward movement.
In order to place winning trades with us via Bybit, You can open an account here.