Arbitrum (ARB) Price Up 1.60%: Can It Break Past Resistance at $0.7240?
Estimated Reading Time: 3 minutes
Don’t invest unless you’re prepared to lose all the money you invest. This is a high-risk investment and you are unlikely to be protected if something goes wrong. Take 2 minutes to learn more

Arbitrum (ARB) Technical Analysis – July 11
Arbitrum (ARB) is showing steady progress with its price (at press time) currently at $0.7115, reflecting a 1.60% increase over the past 24 hours. During this period, 107,265,420 ARB coins were traded, resulting in a trading volume of $76,488,822.
This technical analysis will explore Arbitrum’s performance through its daily and 4-hour charts.
Source: TradingView
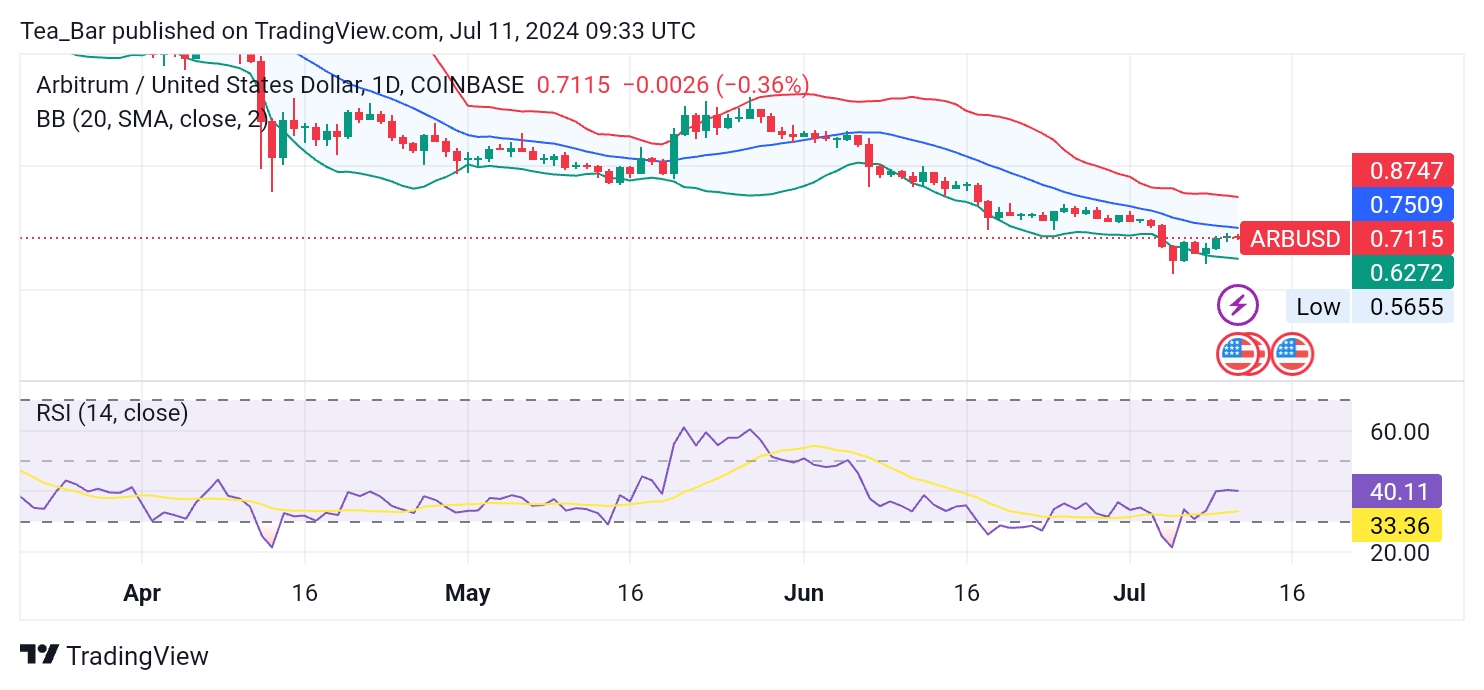
Daily Chart Analysis
On the daily chart, Arbitrum (ARB) opened at $0.7142 and is currently down by 0.16% from the opening price. Despite reaching an intraday high of $0.7240, ARB faced resistance and couldn’t sustain its upward movement. Over the past 30 days, ARB has dropped by 28.50% from its maximum value, while it’s down by 9.62% from its peak in the last 7 days.
However, from its minimum price over the same periods, ARB is up by 23.27%, indicating a strong rebound.The Bollinger Bands on the daily chart show an upper band at $0.8747, a middle band at $0.7509, and a lower band at $0.6272.
This suggests potential volatility, with the price nearing the middle band. The RSI (Relative Strength Index) for the past 14 days is at 33.36, indicating that ARB is in the oversold territory. This could hint at a possible upward correction if buying pressure increases.
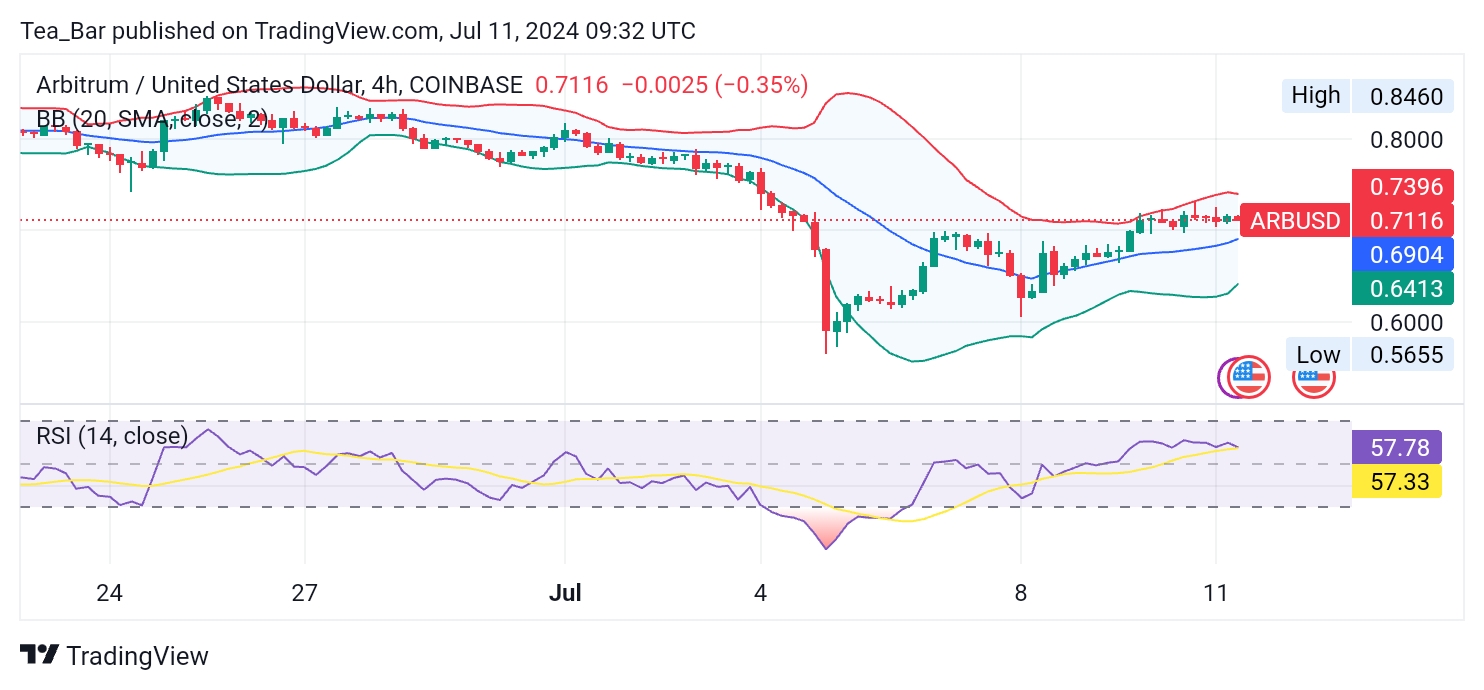
4-hour Chart Analysis
The 4-hour chart offers a closer look at Arbitrum’s short-term performance. The Bollinger Bands show an upper band at $0.7396, a middle band at $0.6904, and a lower band at $0.6413. This tighter range indicates less volatility in the short term compared to the daily chart.
Source: TradingView
The RSI on the 4-hour chart stands at 57.33, suggesting a balanced sentiment among traders.
The 4-hour chart also highlights the resistance faced at the $0.7240 level. However, the RSI and Bollinger Bands suggest that ARB has the potential to test this resistance again. If ARB can break through this level, it may trigger a stronger upward movement.
Conclusion
Arbitrum (ARB) is showing promising signs of recovery with a 1.60% rise over the last 24 hours, backed by significant trading volume. The daily and 4-hour charts indicate some resistance, but the overall technical indicators suggest a potential for continued growth.
Market participants should watch for a break above the $0.7240 resistance level, which could signal a more substantial bullish trend. With its ability to rebound from recent lows and its current stability, Arbitrum appears to have a positive outlook for the near future.
In order to place winning trades with us via Bybit, You can open an account here.