Arbitrum Price Prediction: ARB/USD Faces Continued Downtrend, Market Shows Signs of Potential Short-term Reversal
Estimated Reading Time: 3 minutes
Don’t invest unless you’re prepared to lose all the money you invest. This is a high-risk investment and you are unlikely to be protected if something goes wrong. Take 2 minutes to learn more
Arbitrum Price Prediction: September 3, 2024
Arbitrum (ARB) is currently navigating through a challenging period. As of today, ARB is trading at $0.5053, a few inches down from the previous day’s close. The coin’s price action over the last several months reveals a persistent bearish trend, with ARB struggling to find a solid footing amidst selling pressure.
Despite the overwhelming bearish sentiment, there are signs that ARB could experience a short-term reversal.
ARB/USD Long-term Trend: Bearish (Daily Chart)
Key Levels:
Resistance Levels: $0.5186, $0.5231, and $0.5326.
Support Levels: $0.5077, $0.5100, and $0.5112.
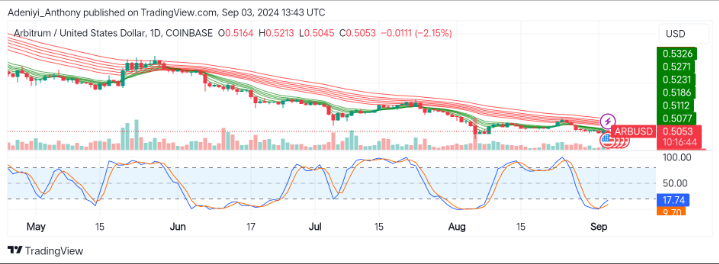
The ARB/USD daily chart shows a consistent downtrend since the fifth month of this year, with prices largely moving below key moving averages, indicating sustained selling pressure.
However, the coin’s recent price actions suggest some short-term upward movement could play out.
Arbitrum Price Prediction: Condition for Potential Upside Movement
With all the recent actions of Arbitrum against the United States dollar clearly under the moving averages for now. The Stochastic Relative Strength Index (SRSI) indicates that ARB is in the oversold region, suggesting a potential short-term upward correction.
In the near term, ARB might experience a brief correction, potentially retesting resistance levels around $0.5112 or $0.5186. However, unless the broader market conditions improve and ARB can break out above its moving averages, the bearish trend is likely to persist.
ARB/USD Medium-term Trend: Bearish (4H Chart)
The ARB/USD 4-hour chart indicates a potential shift from a bearish trend to a neutral or near-bullish trend. The price of the pair has recently attempted to rise above key lines. However, it remains capped by the resistance line.
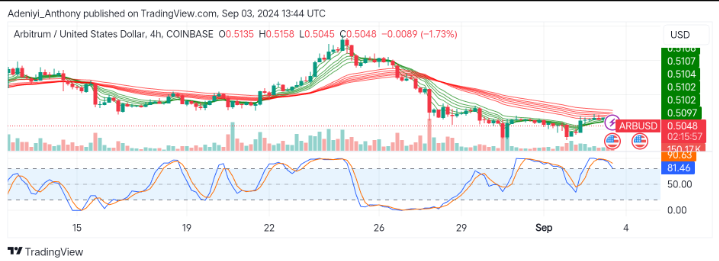
Given the Stochastic RSI overbought condition, ARB may experience a pullback to test support around $0.5048. If this support holds, the price could attempt to break through the resistance levels around $0.5097 to $0.5107.
In summary, the market is in a neutral phase with a slight bullish bias but with the potential for a short-term correction due to overbought signals.
In order to place winning trades with us via Bybit, you can open an account here.