Arbitrum Price Prediction: ARB/USD Seeks Support Near $0.5800
Estimated Reading Time: 3 minutes
Don’t invest unless you’re prepared to lose all the money you invest. This is a high-risk investment and you are unlikely to be protected if something goes wrong. Take 2 minutes to learn more
Arbitrum Price Prediction: September 24, 2024
From the beginning of this year, Arbitrum has been sloping downwards, with some occasional consolidation phases. With bearish overall market sentiment, the price of ARB/USD on the daily chart hovers around $0.5969.
Currently, indicators on the chart suggest the pair is heading towards the nearest support level. However, whether ARB is seeking support to bounce or break the immediate support line, the next price movements will do justice to that.
ARB/USD Long-term Trend: Bearish (Daily Chart)
Key levels
Resistance Levels: $0.6150, $0.6600, and $0.700
Support Levels: $0.5800, $0.5500, and $0.5000
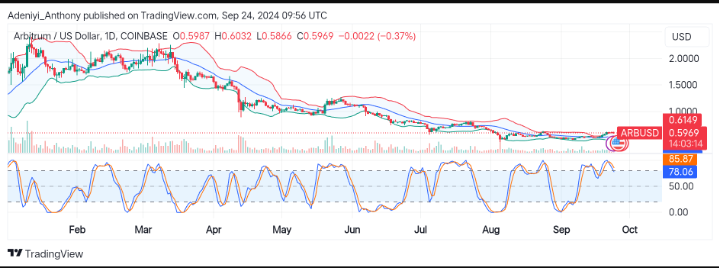
The current position of ARB/USD on the daily chart is just a few inches away from the previous session. However, the general market sentiment is still bearish, and the pair hovers near a critical 0.5800 psychological level.
Currently, the market is ranging, indicating that the pair might hit the immediate support level for a potential short-term upside rebound or continued downtrend.
Arbitrum Price Prediction: What’s Next?
On the daily chart, Arbitrum’s trading volume appears relatively low, and the price can be seen moving along the lower band of the Bollinger band. However, the narrow bands suggest a potential breakout from either side is possible.
On the downside, the Stochastic Relative Strength Index (RSI) displays the pair is near the overbought region. This could signal downside correction or prolonged consolidation.
The relatively low trading volume on another side indicates buyers’ strength is dwindling and sellers may further push the pair beyond the $0.5800 level.
ARB/USD Medium-term Trend: Bullish (4H Chart)
On the other hand, volume on the 4H chart is relatively high, with the price at $0.5985. In this timeframe, the pair is hovering near the upper band of the Bollinger band. This is a signal of overextended bullish run. However, a strong uptrend might continue after a short-term retracement as the Stochastic RSI displays the pair in the oversold territory.
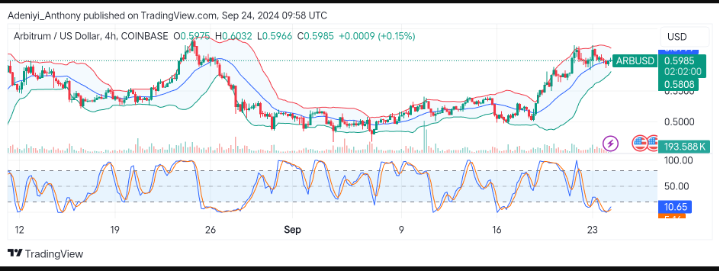
At this juncture, continuation of the bullish run will continue if, after short-term correction, the pair still operates in the middle band and there is a spike in the trading volume.
Finally, there might be a pullback in the future, but the long-term trend could remain bullish; so far, there is volume to enhance the upward trajectory.
In order to place winning trades with us via Bybit, you can open an account here.