Decentraland (MANA/USD) Surges—But Is It a Genuine Shift or Just a Rebound?
Estimated Reading Time: 3 minutes
Don’t invest unless you’re prepared to lose all the money you invest. This is a high-risk investment and you are unlikely to be protected if something goes wrong. Take 2 minutes to learn more
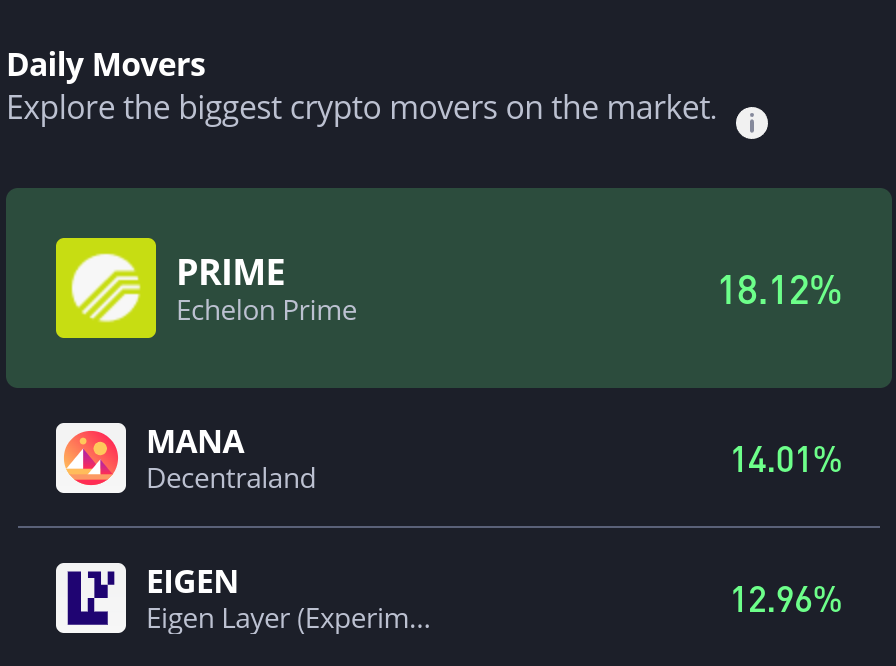
Decentraland (MANA/USD) experienced a strong surge in bullish momentum during today’s trading session, pushing the price toward the $0.30 level before facing resistance. The upward move was met with profit-taking by short-term traders who entered at lower price levels, leading to a brief pullback as gains were quickly realized near this psychological barrier.
Despite the bullish action, the broader market structure remains bearish. The price rejection around the $0.30 mark forms another lower high within a larger downtrend—an indication that bears may still be in control.
The presence of descending peaks on the chart supports the idea that this rally could be a temporary countertrend move rather than the start of a sustained reversal. Until the Decentraland price breaks above previous highs with conviction, the overall bias remains tilted to the downside.
Decentraland (MANA/USD) Market Data
- MANA/USD Price Now: $0.277
- MANA/USD Market Cap: $547 million
- MANA/USD Circulating Supply: 1.9 billion
- MANA/USD Total Supply: 2.2 billion
- MANA/USD CoinMarketCap Ranking: #105
Key Levels
- Resistance: $0.30, $0.40, and $0.50
- Support: $0.020, $0.010, and $0.009
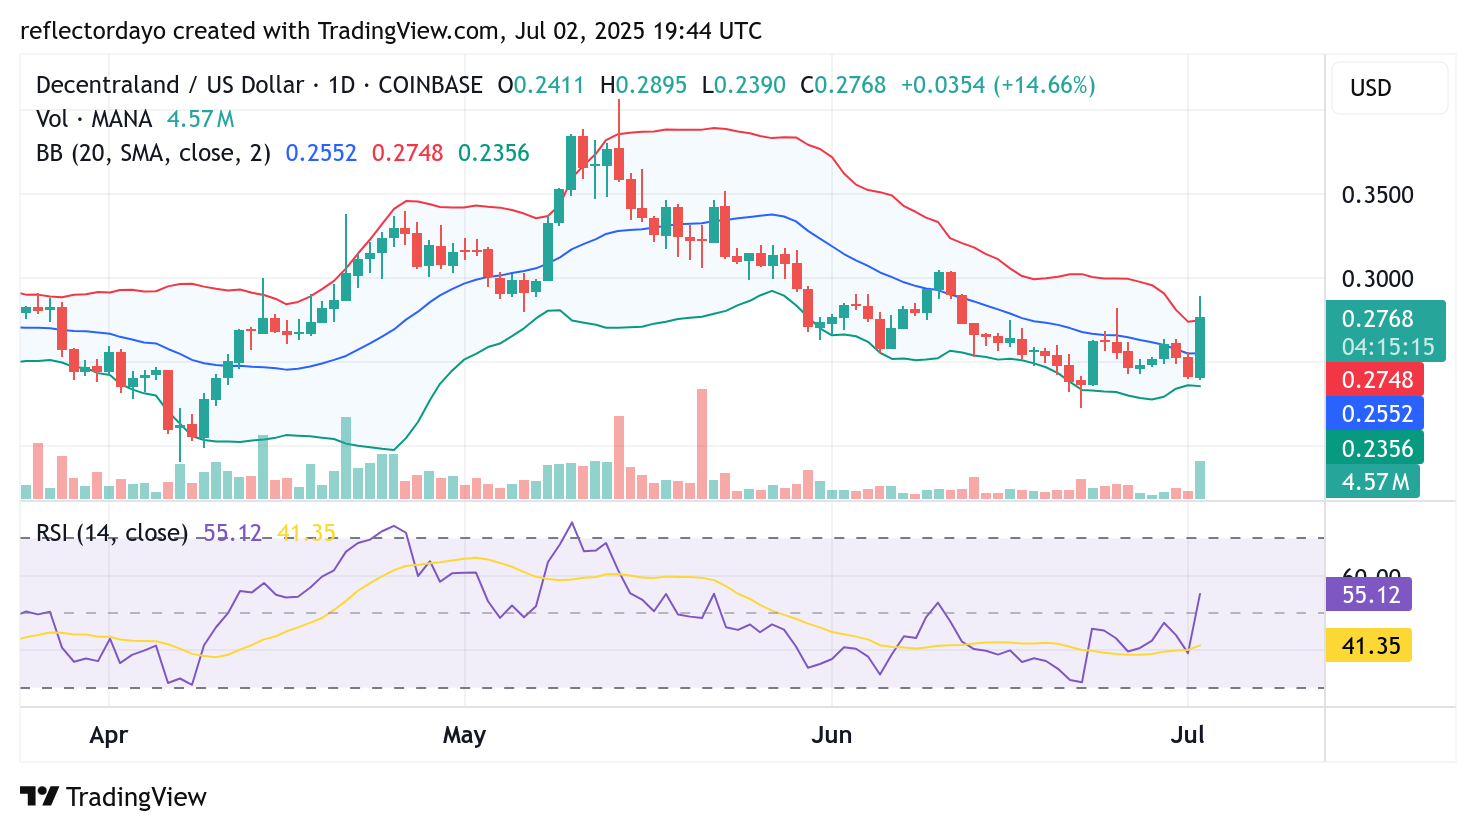
Decentraland (MANA/USD) Daily Chart Outlook: Bulls Eye Breakout as Market Stabilizes Near Key Levels
While the formation of lower peaks reflects the broader bearish structure of the market, notable bullish intervention emerged at the $0.25 support level. This zone has acted as a base where short-term traders stepped in, halting the decline and attempting to push the market in an upward direction.
The bearish momentum was noticeably slowed at $0.25, leading to a period of sideways consolidation, with price action oscillating around this support area. As the market rallied toward the $0.30 resistance level, profit-taking triggered a pullback, bringing the crypto signal down to the current level of $0.277.
This retracement, however, may simply be a natural correction following a strong bullish move—often a typical pattern in volatile markets. The underlying bullish bias remains intact in the short term, and traders are closely watching the $0.30 level as a potential breakout point. A decisive move above this resistance could attract renewed buying interest and confirm a short-term trend shift.
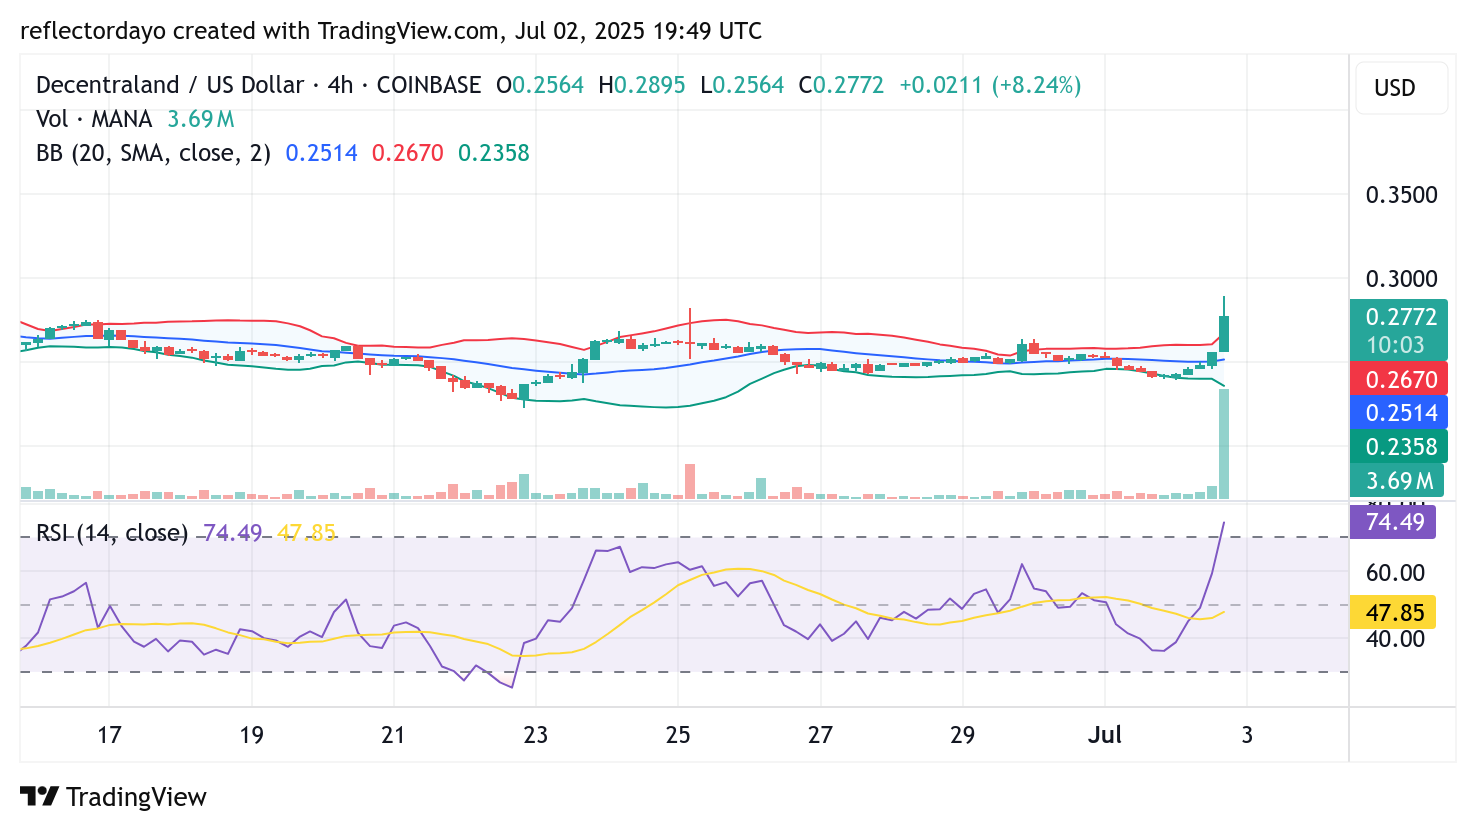
MANA/USD 4-Hour Chart: Bullish Volume Spike Signals Key Battle at $0.30
The 4-hour chart for MANA/USD reveals a sudden surge in trading volume, marked by a towering histogram on the volume indicator. This spike suggests a strong influx of bullish interest, even as price action remains contested near the $0.30 resistance level.
While the bullish volume spike is significantly larger than the corresponding candlestick, this divergence highlights an intense battle between buyers and sellers at this critical zone. The $0.30 level is now a make-or-break pivot point:
Bullish Scenario: A decisive breakout above $0.30 could trigger further buying momentum, potentially pushing MANA/USD toward higher resistance levels.
Bearish Rejection: If the price fails to hold above $0.30, we may see consolidation or a pullback as the market reassesses direction.