SPONGE ($SPONGE) Holds Firm Above Key $0.00011 Support Level
Estimated Reading Time: 3 minutes
Don’t invest unless you’re prepared to lose all the money you invest. This is a high-risk investment and you are unlikely to be protected if something goes wrong. Take 2 minutes to learn more

In a promising development for bullish traders, SPONGE/USD ($SPONGE) has successfully broken above the key $0.00011 resistance level—an area it has been testing repeatedly in recent sessions. The token is now holding above this threshold, signaling renewed buying interest and strength in market sentiment.
While the breakout has heightened market volatility and could potentially trigger a short-term correction, the structure of the move suggests resilience. Should a pullback occur, the $0.00011 level—or slightly lower at $0.000105—is now likely to serve as a strong support zone, cushioning any retracement and maintaining the broader bullish outlook.
Key Technical Levels
- Resistance: $0.000115, $0.000120, $0.000130
- Support: $0.000090, $0.000085, $0.000080
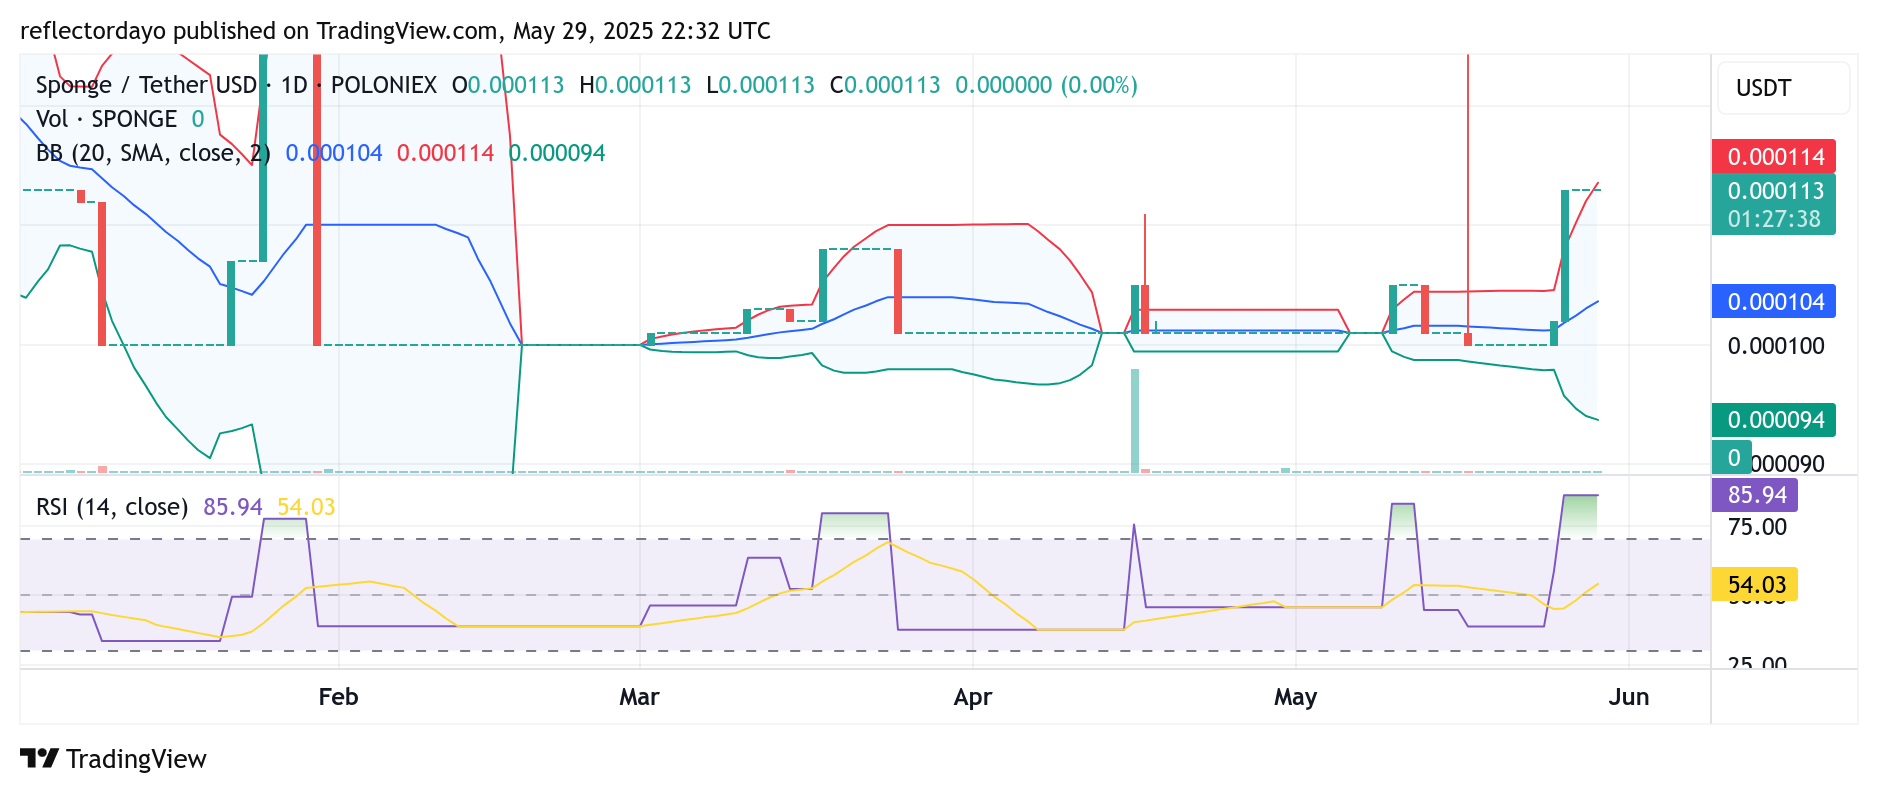
$SPONGE Daily Chart: Overbought Conditions Signal Potential Pullback After Bullish Surge
Technical indicators on the daily chart of SPONGE/USD reveal a significant spike in buying pressure in recent sessions. This momentum led to the formation of a large bullish marubozu candlestick, pushing the price sharply from around $0.000102 to a peak near $0.000113.
Following this strong rally, the price is now consolidating around the $0.00013 level. However, the Relative Strength Index (RSI) is deep in overbought territory, currently hovering around 85—indicating that the market may be due for a short-term correction.
Given the extended move, traders should be cautious of a possible pullback in the crypto signal. A healthy retracement could see price revisit key support zones around $0.00011 or $0.000105. Still, since the recent rally decisively broke past previous resistance levels, there is a strong possibility that bulls will establish a higher support base, sustaining the broader uptrend.
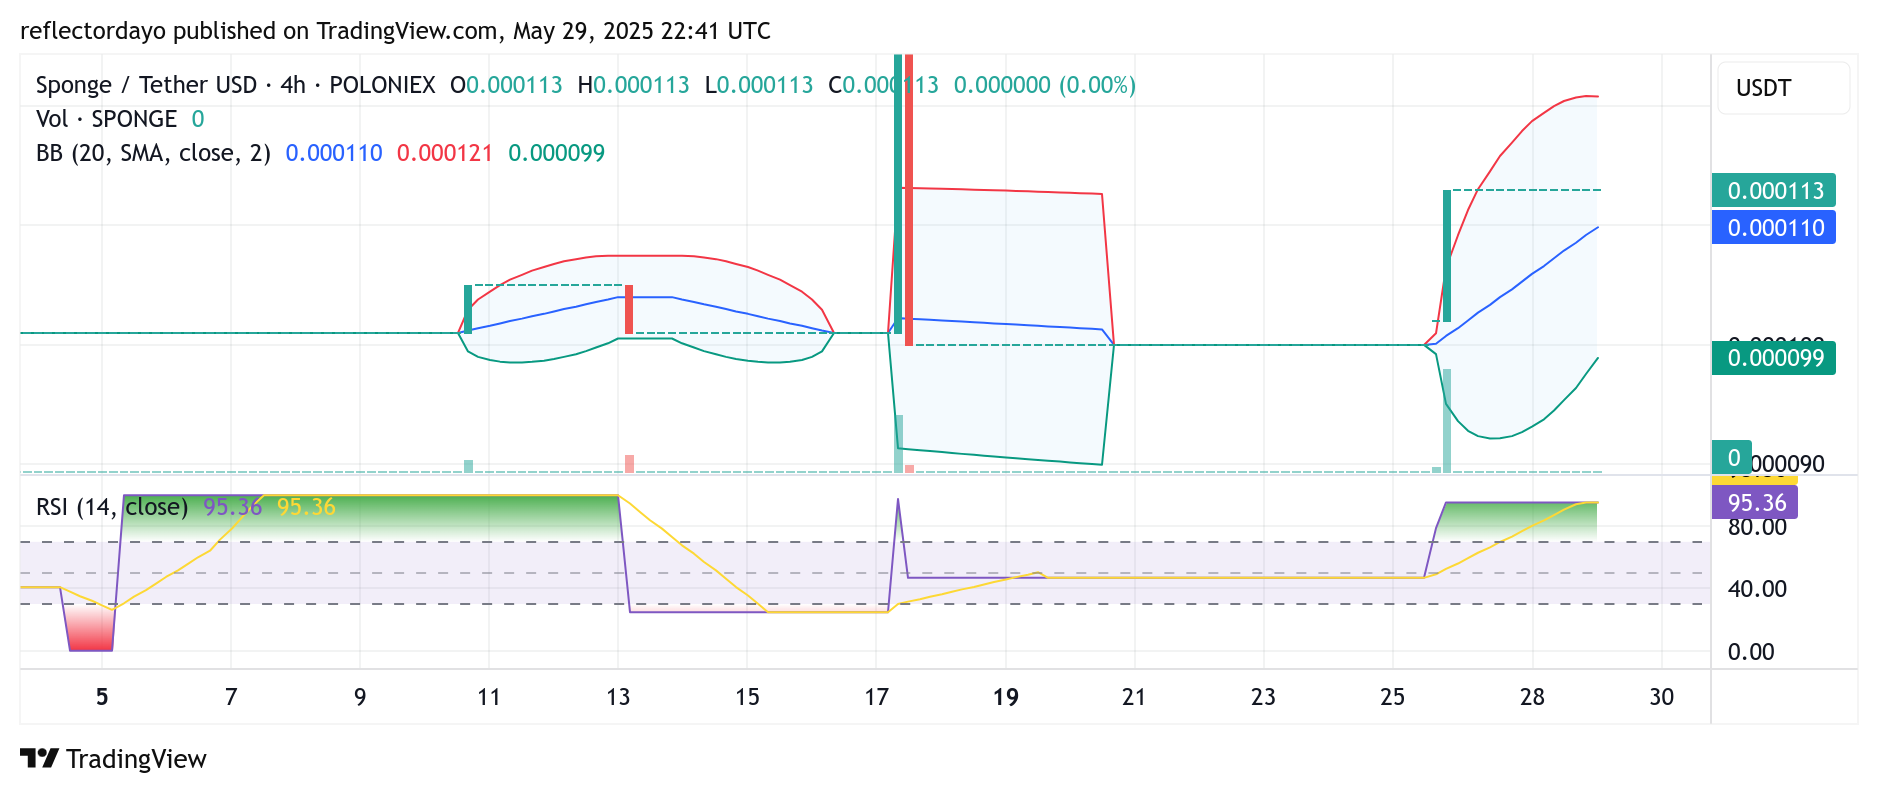
SPONGE/USD 4-Hour Chart: Market Consolidates After Breakout, Eyes Next Support Zone
Bullish momentum remains evident on the 4-hour chart, with all Bollinger Bands indicators trending upward. However, price action has become relatively static around the $0.000113 level, indicating a potential pause in the upward movement.
The 20-period moving average is beginning to catch up with the horizontally moving price, suggesting that the market is entering a consolidation phase. This tug-of-war between buyers and sellers could set the stage for a short-term correction if momentum fades.
Nevertheless, given that the recent breakout decisively breached prior resistance, it’s likely that bulls will establish a higher support level. Should consolidation continue, the Bollinger Bands may contract, setting up the market for its next significant move—either resuming the uptrend or temporarily retracing to gather strength.
Buy $SPONGE!
How crypto bros treat their meme coins 🧽🧽 pic.twitter.com/alSbkGeD7N
— $SPONGE (@spongeoneth) May 29, 2025
Join the SPONGE community and get in on the next big crypto opportunity! Buy Sponge ($SPONGE) today