Stellar has emerged as one of the leading blockchain networks for tokenized assets. At the same time, the price of XLM has rebounded from a higher support level, with price action breaking above a key technical indicator.
A Look at the Stellar 24-Hour Chart
On the daily chart, price action previously tested the support around the $0.1700 level before rebounding higher. More recently, the market found support at approximately $0.1812, establishing a higher low.
Stellar (XLM) Rebounds Off a Higher Support. Source / Cryptosignals : TradingView
The latest candlestick has moved above the 9-day Exponential Moving Average (EMA), reinforcing the bullish outlook. Meanwhile, the Stochastic Relative Strength Index (SRSI) has recently delivered a bullish crossover just below the 50 level, indicating that upward momentum is beginning to build.
XLM Gains Strong Technical Support
From a technical perspective, the Stellar market appears well-positioned for further gains. The current price remains above the 9-day EMA, while the SRSI’s bullish crossover outside the oversold region suggests that buying momentum could strengthen rapidly.
However, traders should note that the candlesticks over the past two sessions have gradually become smaller, indicating that bullish momentum may be slowing slightly in the short term.
Stellar (XLM) Rebounds Off a Higher Support. Source / Cryptosignals : X.com
Stellar’s Medium-Term Target Remains Intact
Price action continues to establish a series of higher support levels, reinforcing the broader bullish trend. In addition, the SRSI crossover below the 50 level suggests that the current recovery is still in its early stages and has room to develop further.
As a result, the $0.2500 price level remains a realistic medium-term target if bullish momentum continues to strengthen.
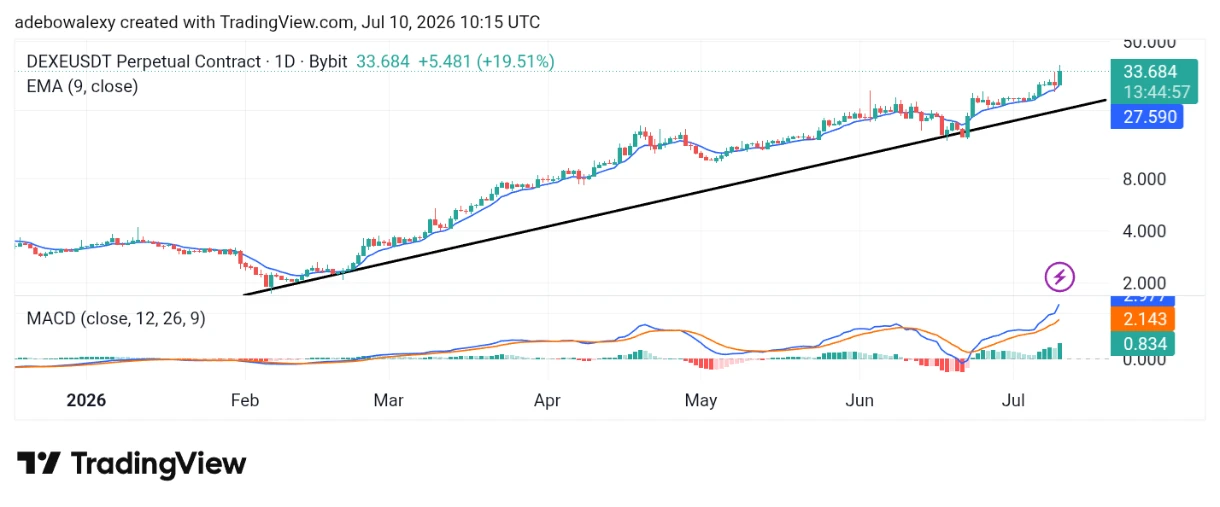
DEXE has gained over 20%, maintaining a strong long-term uptrend.
Price remains above the 9-day EMA, with the MACD signaling continued bullish momentum.
$40 and $50 are the next key upside targets.
The DEXE/USDT market has recorded strong price gains over the past five months. Even today, the token remains firmly bullish, having gained more than 20%. With momentum still intact, further upside appears possible.
DeXe on the 24-Hour Chart
The DEXE market has maintained a long-term bullish trend since February 2026. Today’s session has been particularly strong, with the corresponding bullish candlestick trading well above the 9-day Exponential Moving Average (EMA).
Meanwhile, the Moving Average Convergence Divergence (MACD) indicator remains above the equilibrium level, with its signal lines continuing to point upward. In addition, the MACD histogram bars remain green and above the zero line, confirming sustained bullish momentum.
DEXE Bulls Remain in Control
The DeXe market continues to demonstrate the strength of bullish sentiment. Since rebounding from around the $2 level in February, the token has rallied to trade above $30.
The current session suggests that the uptrend may continue. The MACD lines remain above the equilibrium level and continue to slope upward, while the latest green histogram bar indicates that buying pressure remains strong, supporting the ongoing bullish trend.
With the uptrend still firmly intact, DEXE/USDT remains under strong bullish influence. The latest bullish candlestick reinforces the view that buyers remain in control.
As long as price continues to hold above the 9-day EMA, the market may extend its gains toward the $40 level, with the $50 price mark emerging as the next major upside target.
The Hyperliquid token has recorded impressive growth over the past six months. Its price has climbed from below $20 to well above the $60 level. At the same time, the Hyperliquid ecosystem continues to expand through new integrations while maintaining a strong vision for the future of centralised finance (CeFi), decentralised finance (DeFi), and the broader financial industry.
Hyperliquid on the Daily Price Chart
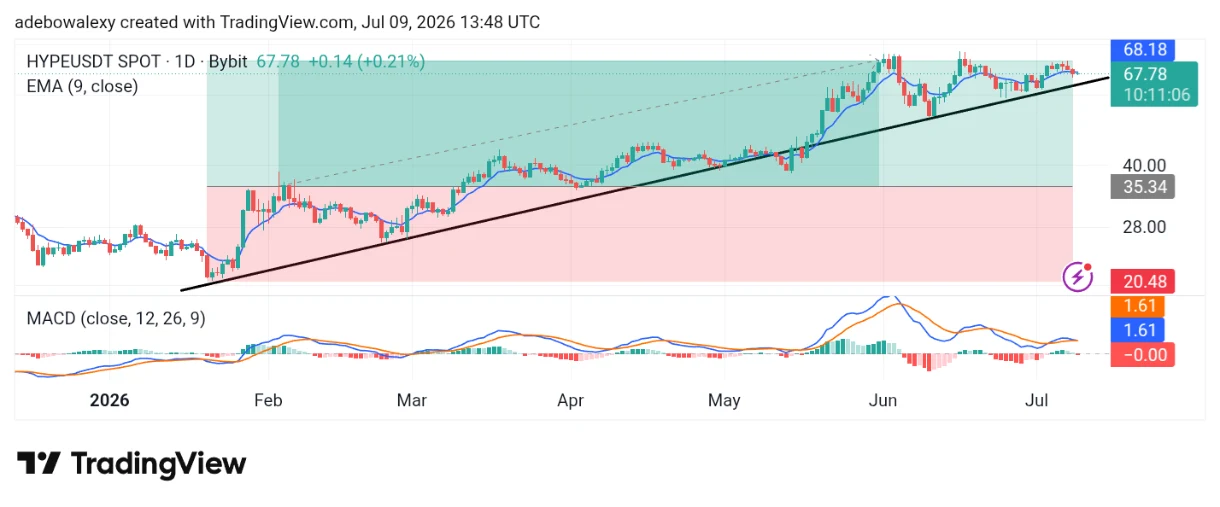
The HYPE/USDT daily chart shows that the market has maintained a strong overall uptrend. Today’s session is represented by a small, almost doji-like candlestick, reflecting market indecision. The candle has formed just below the 9-day Exponential Moving Average (EMA), although price action remains above the ascending trendline.
Meanwhile, the Moving Average Convergence Divergence (MACD) indicator remains above the zero line, with its signal lines converging towards a possible bearish crossover.
HYPE Faces a Short-Term Pullback
The daily chart suggests that although the broader trend remains bullish, the market is experiencing a mild short-term correction. Price has slipped below the 9-day EMA, while the MACD lines are on the verge of a bearish crossover despite remaining above the equilibrium level.
These signals indicate that a temporary pullback may be underway. However, given the strength of the overall trend, traders may consider exercising patience as bullish momentum could soon return.
From both a technical and fundamental perspective, Hyperliquid continues to present a positive long-term outlook. Although bearish pressure has emerged, it appears relatively weak and may prove to be short-lived.
The market has consistently maintained its broader uptrend, even during periods of increased volatility. Coupled with the ongoing developments and growing adoption of the Hyperliquid blockchain, the long-term outlook remains constructive. As a result, traders may continue to view the $100 price level as a realistic long-term target.
Disclaimer:
Note: Cryptosignals.org is not a financial advisor. Do your research before investing your funds in any financial asset, product, or event. We are not responsible for your results.
NEAR has gained nearly 6% as its ecosystem continues to grow.
Price is testing key support within a symmetrical triangle pattern.
A breakout is approaching, with $2.50 and $3.50 as potential upside targets.
As of the time of writing, the price of the NEAR token has gained nearly 6%. This comes as the Near Protocol ecosystem continues to record notable developments, further strengthening expectations of a potential price breakout.
Near Protocol on the 24-Hour Chart
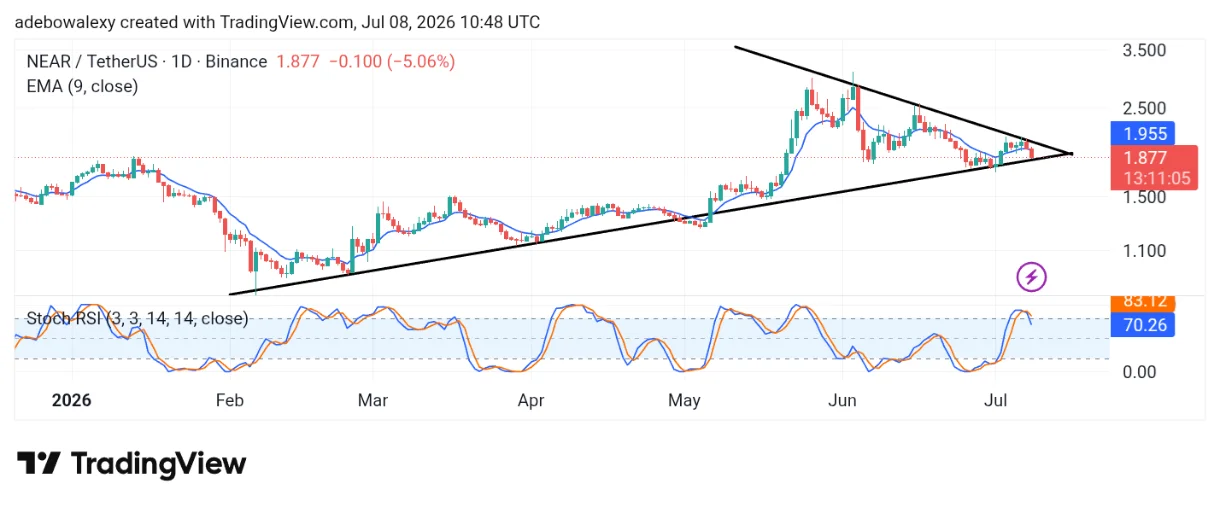
The NEAR/USDT daily chart shows that price action has maintained a broader uptrend since late February. However, since June, the market has entered a mild downward correction, forming a symmetrical triangle pattern.
Near Protocol (NEAR) Has Equal Breakout Potential / Cryptosignals : TradingView
The current session is bearish, with price trading below the 9-day Exponential Moving Average (EMA). As a result, the market is now testing the lower boundary of the symmetrical triangle. Meanwhile, the Stochastic Relative Strength Index (SRSI) is declining toward the 70 level, indicating that bullish momentum is beginning to weaken.
NEAR Faces a Crucial Breakout
From a technical perspective, NEAR appears to be approaching a potential downside breakout from the symmetrical triangle. However, the breakout has not yet been confirmed, leaving room for a bullish reversal.
The token’s nearly 6% gain today suggests that buyers are actively defending key support levels. Additionally, the SRSI remains above the 70 mark, indicating that bullish momentum has not completely faded and buyers may still have an opportunity to regain control.
Near Protocol (NEAR) Has Equal Breakout Potential. Source / Cryptosignals : X.com
A Potential Entry Opportunity
The NEAR/USDT market is currently at a decisive point. The symmetrical triangle pattern suggests that both bullish and bearish breakouts remain possible.
However, considering the market’s longer-term uptrend, a bullish breakout remains a realistic scenario. If buyers regain momentum, traders may look toward the $2.50 and $3.50 price levels as potential upside targets.
Disclaimer:
Note: Cryptosignals.org is not a financial advisor. Do your research before investing your funds in any financial asset, product, or event. We are not responsible for your results.
SOL has rallied from $60 to above $80, supported by strong fundamentals.
Price remains above the 9-day EMA despite short-term consolidation.
$100nis the next key target, with $150 possible if bullish momentum continues.
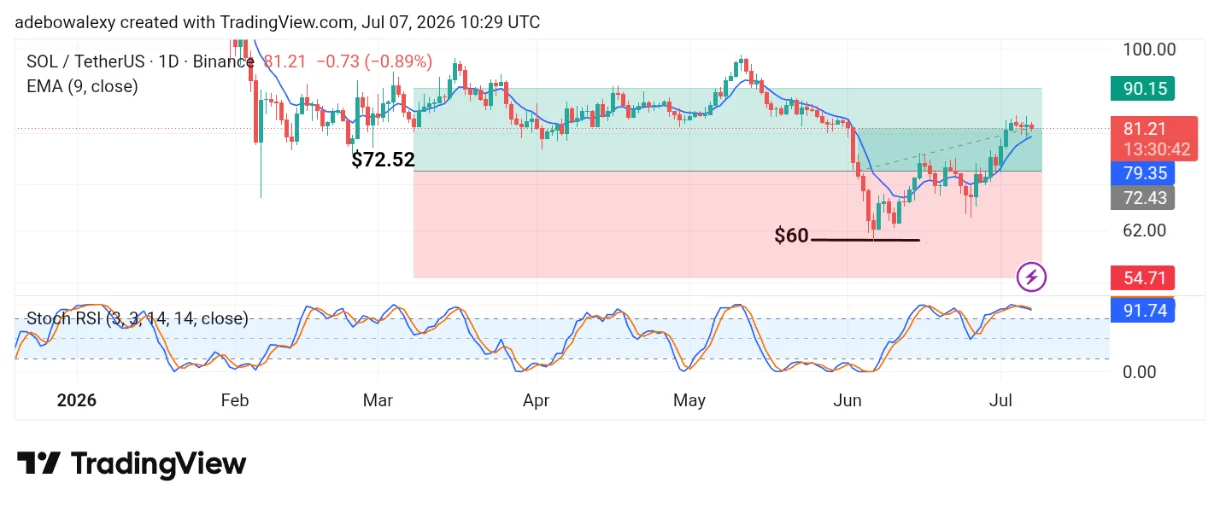
Both the Solana ecosystem and its native token have continued to record steady growth recently, supported by positive price action and strong fundamentals. Since rebounding from the $60 support level, SOL has climbed above $80. Let’s take a closer look at what may come next for the market.
Solana on the 24-Hour Chart
The daily chart shows that Solana rebounded strongly from the support level around $60. Since that recovery on June 7, the market has generally maintained an upward trajectory. However, over the past three sessions, price action has moved sideways, suggesting that bullish momentum is taking a brief pause.
Solana (SOL) Bulls Are Catching Their Breath, but Growth Continues. Source / Cryptosignals : TradingView
Despite this consolidation, SOL has remained above $80, representing a gain of roughly $20 from the recent low. Meanwhile, the Stochastic Relative Strength Index (SRSI) has flattened in the overbought region, reflecting the market’s current sideways movement.
Examining the Technical Outlook
From a technical standpoint, the Solana market appears overbought. The recent sideways movement indicates that bullish momentum has slowed after a strong rally. Nevertheless, price action continues to trade above the 9-day Exponential Moving Average (EMA), which remains an important support level.
In addition, the SRSI is still hovering around the 91 level in the overbought region. As long as the market continues to hold above the 9-day EMA, the broader bullish trend remains intact.
Possible Direction for SOL
Given that price action continues to hold above key support levels, the current uptrend appears likely to continue after this period of consolidation.
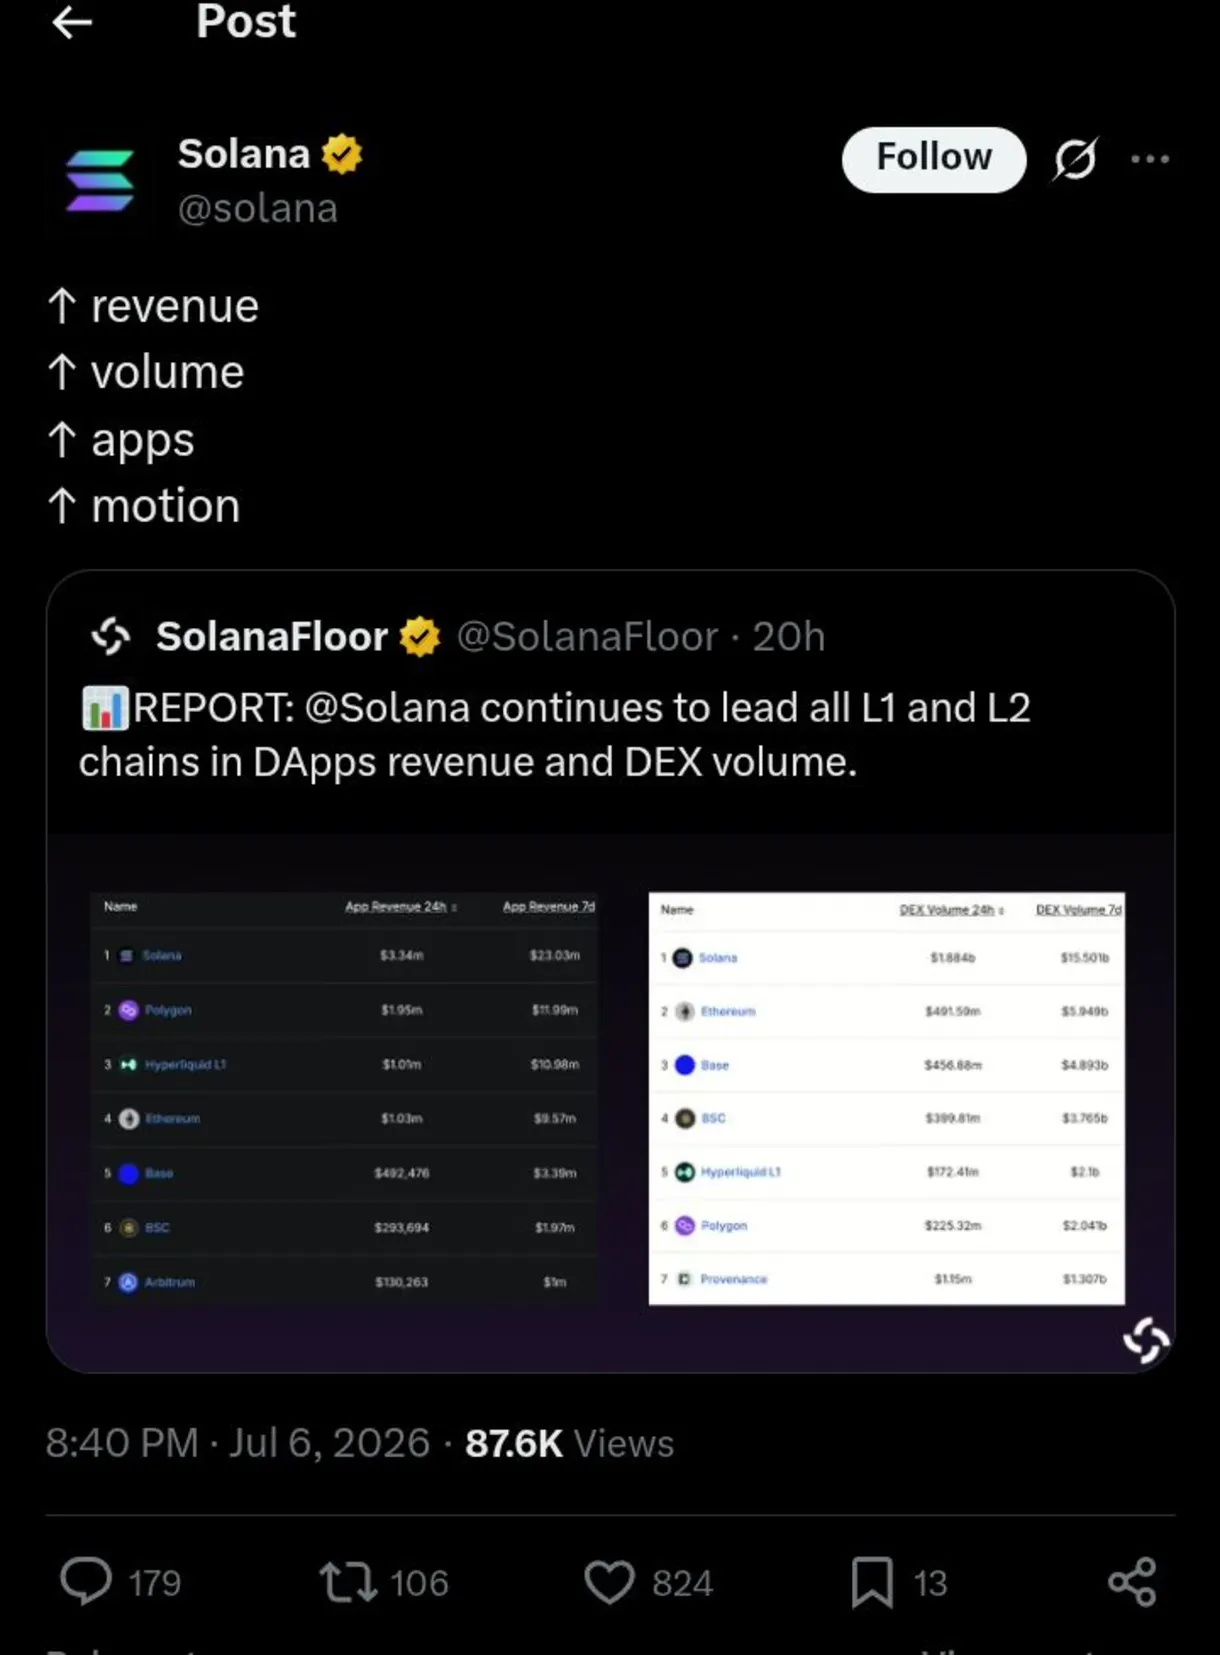
Solana (SOL) Bulls Are Catching Their Breath, but Growth Continues. Source / Cryptosignals : X.com
Furthermore, Solana’s fundamentals remain strong, with recent reports indicating that the Solana blockchain continues to lead among Layer 1 and Layer 2 ecosystems in terms of growth and activity.
These positive developments could continue attracting investors and supporting higher prices. As a result, the $100 level remains a realistic near-term target, while a move toward $150 could become achievable if bullish momentum continues to strengthen.
Disclaimer:
Note: Cryptosignals.org is not a financial advisor. Do your research before investing your funds in any financial asset, product, or event. We are not responsible for your results.
Bitcoin is the most decentralized cryptocurrency and a leading store of value.
Other blockchains trade some decentralization for speed, scalability, and functionality.
Evaluate projects by how well their design fits their purpose, not decentralization alone.
Every cryptocurrency has its own strengths and limitations. Therefore, it is important to understand why different blockchain networks make different design choices. Each cryptocurrency has a unique value proposition and serves a specific purpose.
Bitcoin is widely regarded as the most decentralized cryptocurrency ever created. Its architecture makes it extremely difficult for any single individual or organization to control the network. This high level of decentralization is what gives Bitcoin its unique value as a censorship-resistant store of value.
Crypto Centralization: Why Some Networks Are More Centralized Than Others. Source / Cryptosignals : Pixabey
Why Bitcoin Stands Out
Not all digital assets aim for the same level of decentralization as Bitcoin. Many blockchain networks prioritize transaction speed, scalability, lower costs, or advanced functionality instead. Understanding these trade-offs is essential for investors and financial advisors evaluating digital asset investments.
Bitcoin’s decentralization is the foundation of its value. With no central authority, an anonymous creator, and a proof-of-work consensus mechanism, Its high level of security and resistance to censorship have made it one of the most trusted digital assets. Combined with its decentralized and immutable design, it occupies a unique position that few other blockchain networks seek to replicate.
Why Other Networks Are More Centralized
Unlike Bitcoin, Ethereum was designed to support smart contracts and decentralized applications. Its ecosystem is strongly associated with Vitalik Buterin, who remains one of its most influential figures. To support programmability, innovation, and protocol upgrades, Ethereum sacrifices some of the anonymity associated with Bitcoin. In return, it provides a platform for smart contracts, tokenized assets, decentralized finance (DeFi), and numerous blockchain-based applications—capabilities Bitcoin was never intended to offer.
Other blockchain networks also make different trade-offs based on their objectives. Solana, for example, relies on a relatively smaller validator set and higher hardware requirements, enabling it to process thousands of transactions per second at very low cost. This design sacrifices some decentralization in exchange for exceptional speed and scalability.
Crypto Centralization: Why Some Networks Are More Centralized Than Others. Source / Cryptosignals : Pixabay
BNB Chain follows a similar approach by using an even smaller validator set to achieve fast transaction finality and low fees. This design supports the Binance ecosystem, where efficiency is often prioritized over maximum decentralization.
Meanwhile, Hyperliquid focuses on delivering high-performance trading. Its application-layer architecture is optimized for near-instant transaction execution, making it well suited for exchange operations where speed and responsiveness are essential.
Why This Matters for Advisory Purposes
It is important to understand that neither decentralization nor centralization is inherently good or bad. They are simply design choices that blockchain projects make to achieve specific goals.
For example, Bitcoin’s high level of decentralization makes it an excellent store of value. Ethereum’s architecture enables programmable smart contracts and decentralized applications, while Solana’s design allows it to deliver high-speed, low-cost transaction processing.
When evaluating digital assets, the key question is not whether a project is “decentralized enough.” Instead, investors should assess whether its design choices and trade-offs align with its intended purpose. This framework provides a more balanced and practical approach to evaluating digital asset investments.
Disclaimer:
Note: Cryptosignals.org is not a financial advisor. Do your research before investing your funds in any financial asset, product, or event. We are not responsible for your results.
For years, cryptocurrencies have largely existed alongside the traditional banking system, requiring investors to open separate exchange accounts before they could buy digital assets. That barrier is beginning to disappear in Germany. The country’s largest savings and cooperative banking networks are rolling out crypto trading services through their banking apps, a move that could bring digital assets within reach of millions of everyday customers.
More than just another institutional crypto announcement, the development underscores how traditional finance is increasingly embracing digital assets as part of mainstream banking.
Bringing Crypto Closer to Everyday Investors
According to recent reports, Germany’s savings banks and cooperative banking groups are expanding crypto trading services through their respective financial partners, enabling retail customers to buy and sell cryptocurrencies directly from their banking applications. While the rollout will be implemented across participating institutions over time, the initiative has the potential to significantly expand crypto accessibility in one of Europe’s largest banking markets.
Two bitcoin coins are on the screen of a trading chart via the smartphone. Source: create.vista.com / cryptosignals
The biggest impact may be the removal of long-standing barriers to entry. Instead of registering with dedicated crypto exchanges, completing separate identity verification processes, and transferring funds between platforms, customers will be able to access digital assets through banking apps they already use for everyday financial transactions. That convenience could encourage more first-time investors to explore cryptocurrencies.
A Shift in Banks’ Attitude Toward Crypto
The move also highlights how dramatically traditional financial institutions’ perception of crypto has evolved. Many banks that once warned customers about the risks associated with digital assets are now integrating crypto trading into their product offerings.
This change reflects growing customer demand as well as increased regulatory certainty across Europe under the Markets in Crypto-Assets (MiCA) framework. Rather than viewing cryptocurrencies solely as speculative assets, banks are beginning to see them as legitimate investment products capable of generating new revenue while helping them remain competitive in an increasingly digital financial landscape.
The development could also reshape competition within the crypto industry. As banks offer seamless access to digital assets through trusted mobile banking platforms, crypto exchanges may face greater pressure to compete through lower fees, broader asset selections, staking opportunities, and more advanced trading features.
X post reporting the expansion of a top bank in Germany expanding into crypto offerings. Source: X / cryptosignals
What It Means for Investors
For investors, Germany’s latest banking initiative represents another milestone in crypto’s journey toward mainstream financial acceptance. Easier access through trusted banking institutions could encourage broader retail participation, improve market liquidity, and strengthen confidence in the long-term growth of the digital asset ecosystem.
While widespread adoption will likely take time, the direction is becoming increasingly clear: cryptocurrencies are steadily moving from the financial sidelines into everyday banking. If similar initiatives gain traction across Europe and other major markets, they could accelerate global crypto adoption and reinforce digital assets’ position as an increasingly important component of the modern financial system.
Note:
Cryptosignals.org is not a financial advisor. Do your research before investing your funds in any financial asset, product, or event. We are not responsible for your results.
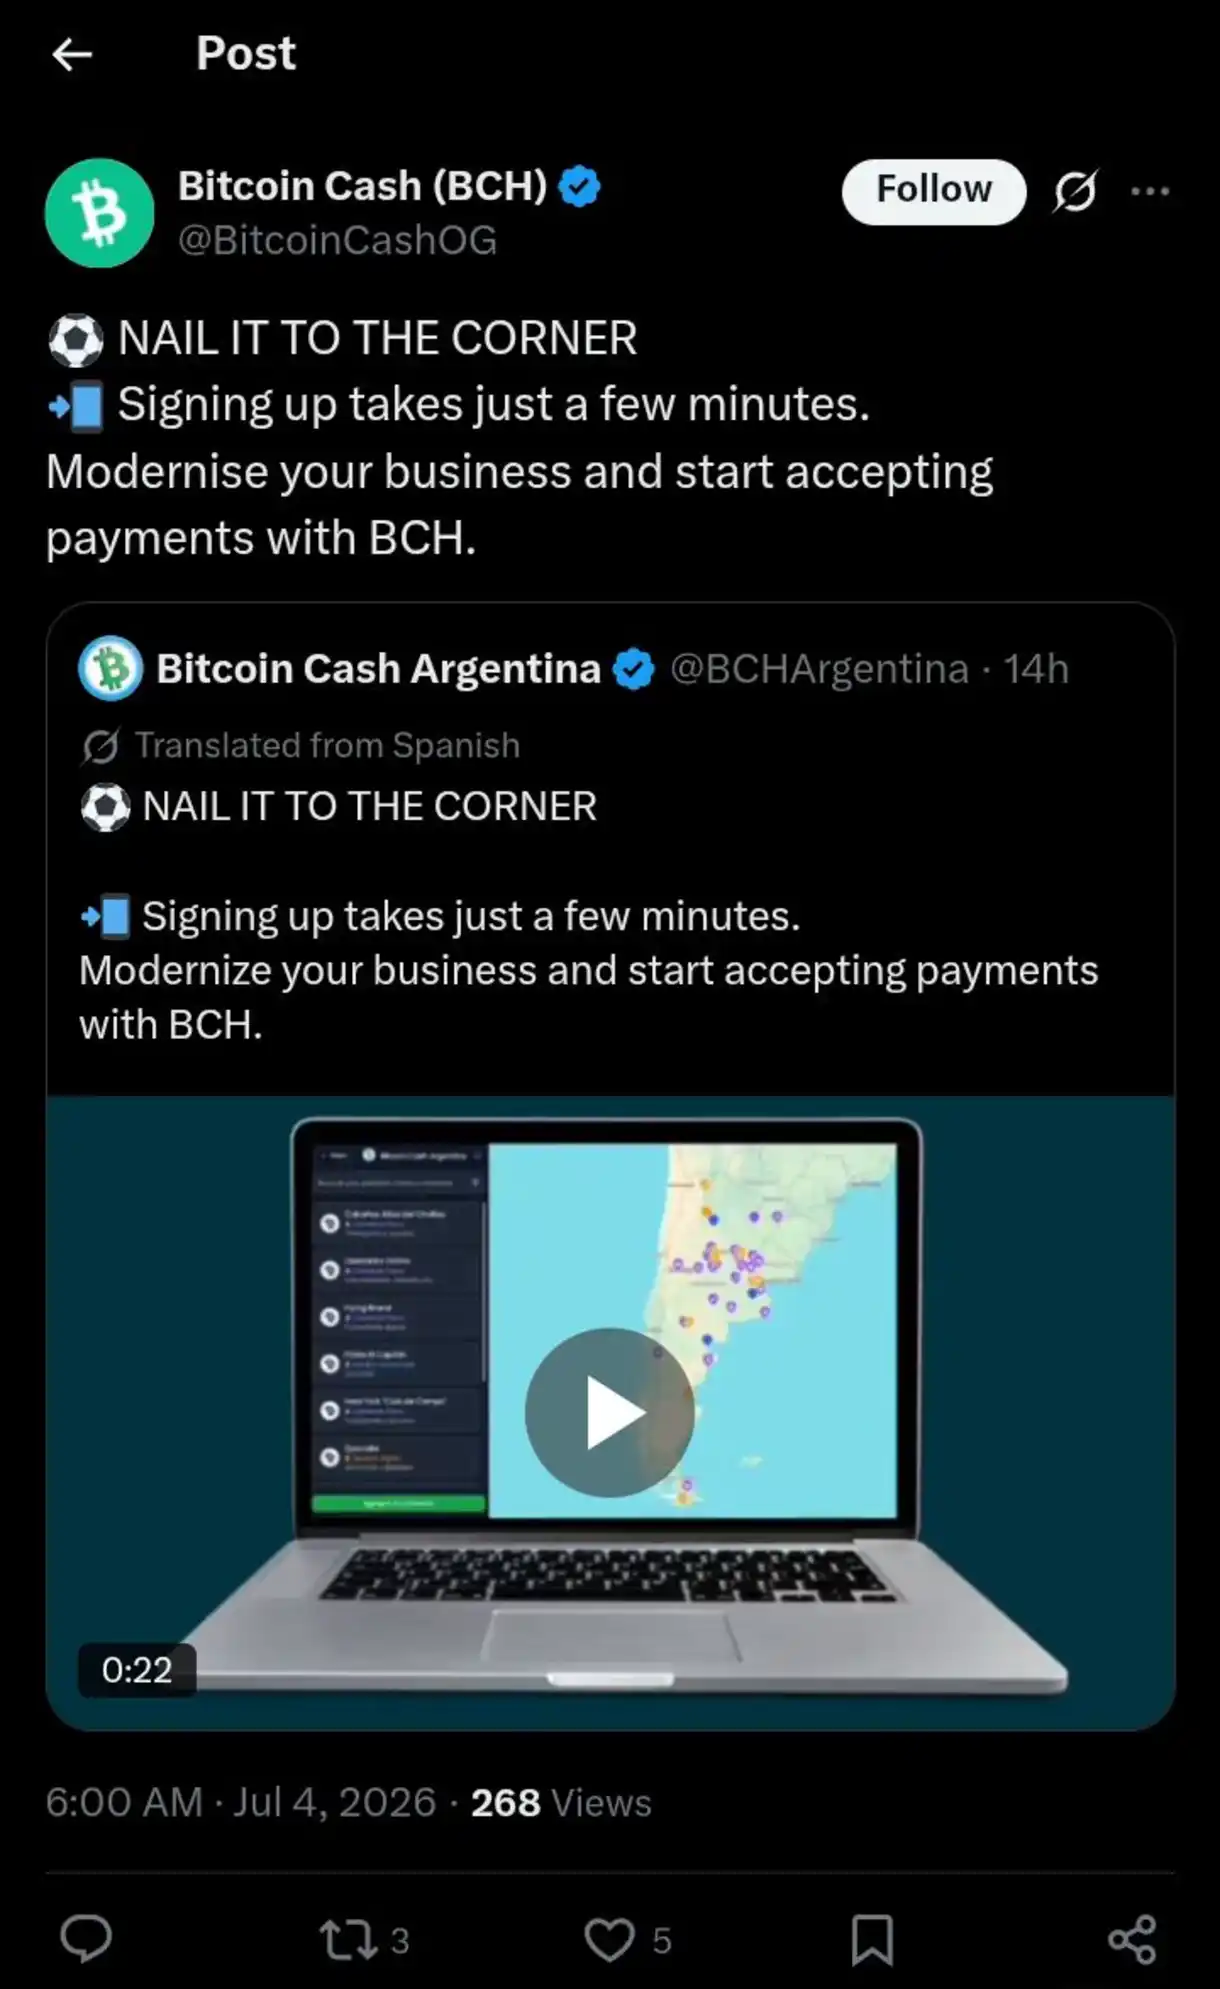
BCH has confirmed a bullish breakout above the 9-day EMA.
Short-term momentum is slowing as the SRSI enters overbought territory.
Medium- and long-term targets remain at $300 and $400, respectively.
As the cryptocurrency market continues its broader recovery, Bitcoin Cash (BCH) has also joined the rally. In addition, efforts to promote BCH as a legal payment option for goods and services could further strengthen investor interest and support the token’s long-term price outlook.
BCH on the Daily Chart
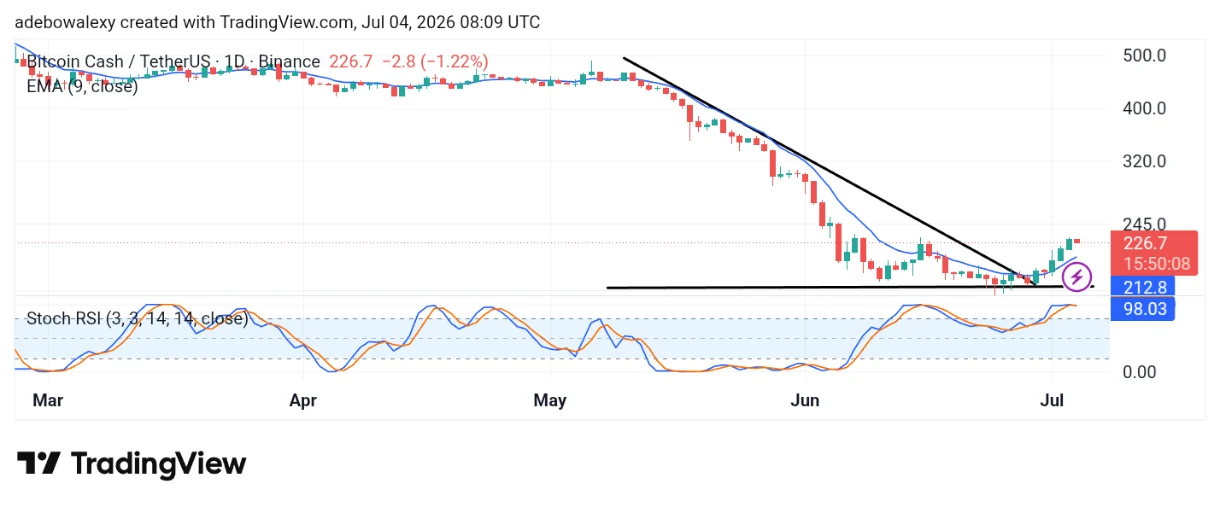
The Bitcoin Cash daily chart shows that price action has finally broken out, as anticipated a week ago. Earlier, the market formed a falling wedge pattern, a technical formation that often signals a bullish breakout. Price has now moved above the 9-day Exponential Moving Average (EMA), confirming improved bullish momentum.
Bitcoin Cash (BCH) Breaks Out as Expected. Source / Cryptosignals : TradingView
However, the latest daily candle is bearish, while the Stochastic Relative Strength Index (SRSI) has begun to flatten after reaching overbought territory, suggesting that bullish momentum may be slowing.
What Could Happen Next?
The appearance of a red candle during the current session indicates that the recent rally may be pausing. This could either be a temporary pullback or the beginning of a deeper correction.
The SRSI has reached the 100 level and is now turning lower toward the 80 mark, indicating that selling pressure may gradually increase. Nevertheless, price action remains comfortably above the 9-day EMA, suggesting that the broader bullish trend is still intact.
BCH Outlook Remains Positive
Although the recent breakout has been followed by a bearish candle, the overall technical outlook remains constructive. Price continues to trade well above the 9-day EMA, even as the SRSI signals that the market may be entering a short-term consolidation phase.
Bitcoin Cash (BCH) Breaks Out as Expected. Source / Cryptosignals : X.com
At the same time, ongoing efforts to expand Bitcoin Cash’s use as a payment method could provide additional long-term support. As a result, traders may continue targeting a recovery toward the $300 level in the medium term, with the $400 region remaining a longer-term bullish objective if momentum continues to build.
Disclaimer:
Note: Cryptosignals.org is not a financial advisor. Do your research before investing your funds in any financial asset, product, or event. We are not responsible for your results.
Price is above the 9-day EMA, but momentum is overbought.
$0.2500 remains the next key target.
While the broader cryptocurrency market has experienced a recovery following Bitcoin’s move back above the $60,000 level, Cardano has delivered an even stronger performance. This rally appears to be supported by growing institutional interest and increased buying activity.
What the ADA Daily Chart Is Saying
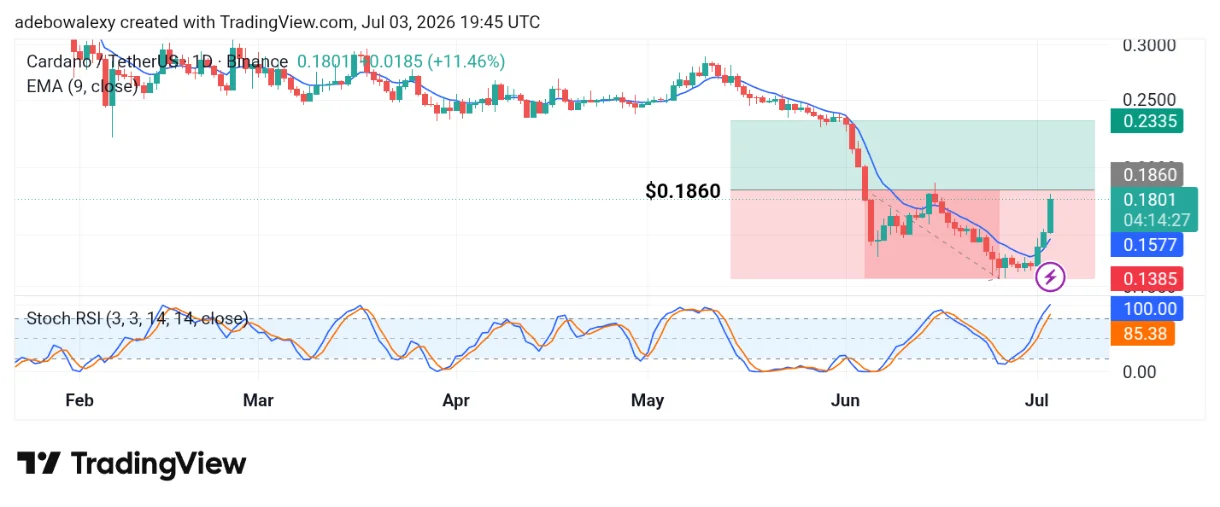
The Cardano market has gained significant bullish momentum. The current session is represented by a long green candlestick with a relatively small upper shadow, suggesting that buying pressure remains dominant.
Cardano (ADA) Surges Over 13%. Source / Cryptosignals : TradingView
Price action is now trading comfortably above the 9-day Exponential Moving Average (EMA), reinforcing the bullish outlook. Meanwhile, the Stochastic Relative Strength Index (SRSI) has moved into the overbought region. Despite this strong momentum, the market remains below the major bullish zone indicated on the chart.
Cardano Bulls Appear Slightly Strained
Although ADA/USDT continues to perform strongly, there are signs that bullish momentum may be approaching exhaustion. The SRSI lines are deep within the overbought region, which typically indicates that the market may be due for a pullback.
At the same time, price action remains firmly above the 9-day EMA, highlighting the strength of the current uptrend. However, the market continues to trade below the long-term bullish region, suggesting that some resistance may still lie ahead. Nevertheless, strong fundamental developments could allow ADA to maintain its upward momentum despite these technical warning signs.
ADA May Reach Higher Targets
As of the time of writing, bullish momentum in the Cardano market remains impressive. The token has recorded an intraday gain of more than 13%, outperforming many of the top cryptocurrencies, which have posted gains of less than 10%.
Cardano (ADA) Surges Over 13%. Source / Cryptosignals : YouTube
This strong buying activity supports a positive short-term outlook and could drive the market toward nearby resistance levels. However, traders may also consider the longer-term implications of increasing institutional interest, which could provide a foundation for sustained growth. As a result, ADA may continue its advance toward the $0.2500 price level over time.
Disclaimer:
Note: Cryptosignals.org is not a financial advisor. Do your research before investing your funds in any financial asset, product, or event. We are not responsible for your results.