- The Edel exploit exposes hidden risks in tokenized-stock lending.
- Tokenized assets need stronger security as DeFi evolves.
- The future of DeFi depends on safer collateral management.
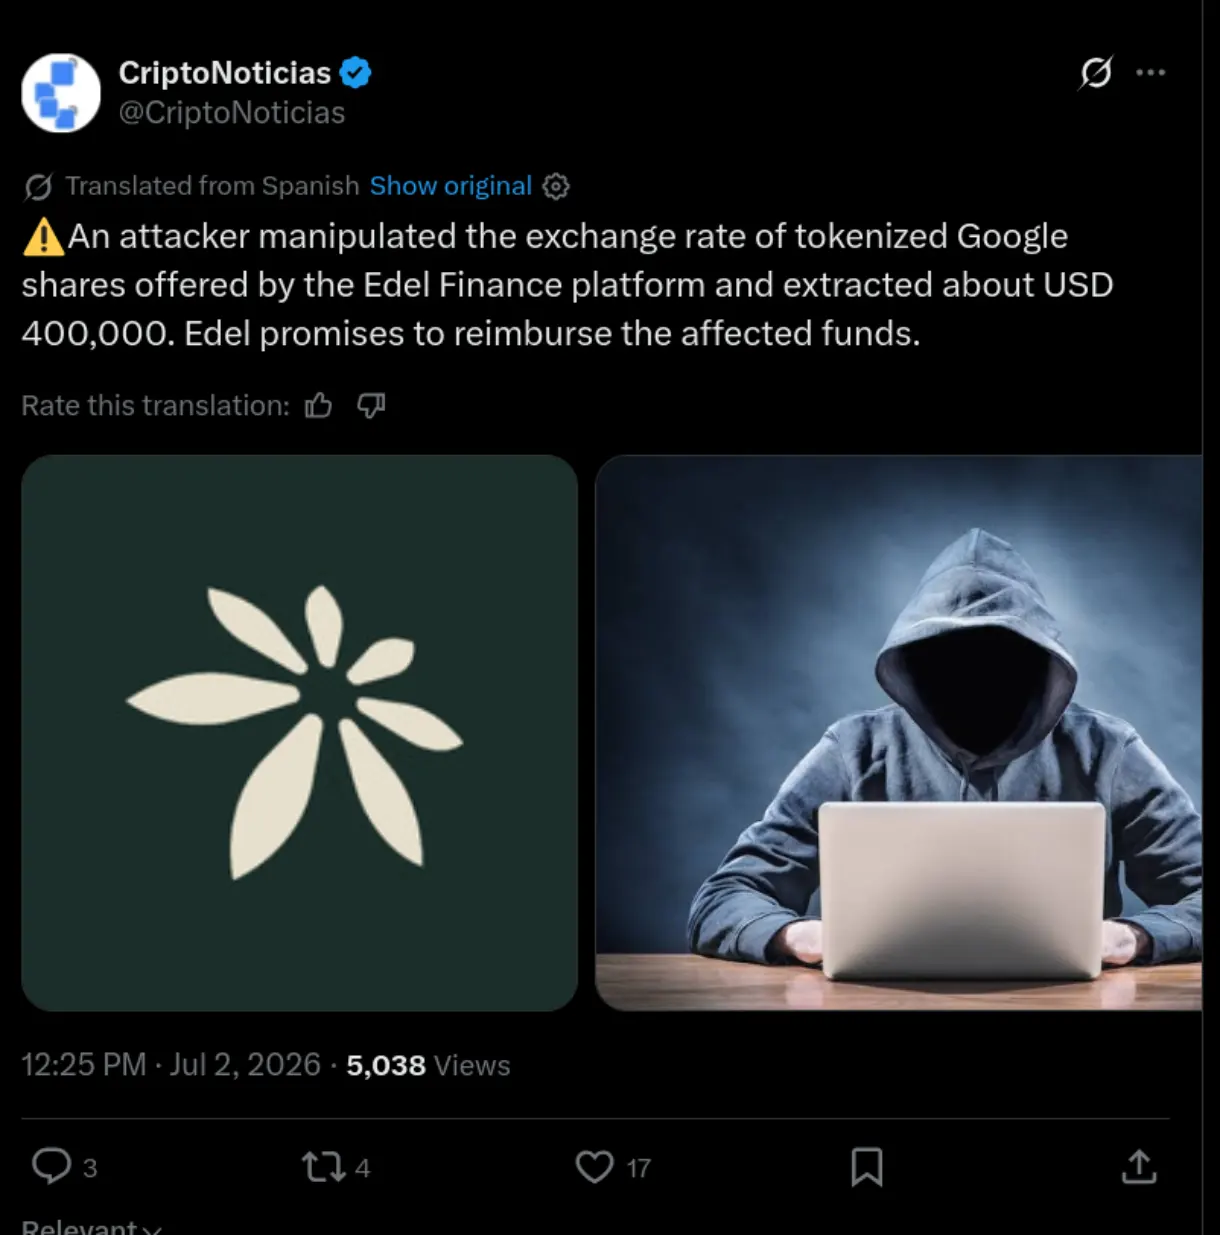
The recent exploit of Edel Finance has put tokenized stocks under an uncomfortable spotlight. An attacker manipulated the protocol’s wrapped Google stock collateral, leaving hundreds of thousands of dollars in bad debt despite the use of trusted pricing infrastructure. While the protocol has pledged to make users whole, the incident raises a much bigger question: Are tokenized stocks introducing new security risks that DeFi has yet to fully solve?
As tokenized assets continue to gain momentum, this exploit serves as an early warning that innovation must be matched with stronger safeguards.
How attacks like this happen
Unlike traditional crypto lending, tokenized stocks rely on multiple layers of infrastructure, including wrapped assets, collateral valuation models, and exchange-rate mechanisms. If a protocol incorrectly calculates the value of these assets, attackers can exploit the discrepancy.
Bad actors often combine flash loans with rapid borrowing and repayment cycles to inflate collateral values temporarily. Once the protocol recognizes the manipulated collateral as more valuable than it actually is, the attacker can borrow assets far beyond their legitimate limit before the system corrects itself.
These attacks typically unfold within a single blockchain transaction, making them extremely difficult to stop in real time.

Why tokenized stocks face unique risks
Tokenized stocks are designed to bring traditional financial assets onto the blockchain, unlocking around-the-clock trading, global accessibility, and integration with DeFi applications. However, every additional layer—whether wrapping, tokenization, or collateral management—creates another potential point of failure.
The Edel incident demonstrates that even if an external price feed remains accurate, weaknesses in a protocol’s internal valuation logic can still expose users and liquidity providers to significant losses.
As more tokenized assets enter DeFi, protocols must ensure that every component of the valuation process is as secure as the underlying asset itself.
How DeFi is likely to evolve
The good news is that incidents like Edel often accelerate security improvements across the industry.
Future DeFi lending protocols are expected to adopt stronger collateral verification, more resilient exchange-rate models, tighter borrowing limits for newly listed assets, and automated circuit breakers that pause abnormal activity before losses escalate. Developers are also likely to introduce multiple layers of validation instead of relying on a single pricing mechanism.
These improvements will make it increasingly difficult for attackers to exploit valuation gaps while helping protocols respond more quickly to suspicious activity.
Final thoughts
The Edel exploit should not be viewed as a failure of tokenized stocks themselves but as an important lesson for the next generation of DeFi infrastructure. As tokenized assets become more common, security must evolve alongside innovation.
For investors, the takeaway is simple: attractive yields should never replace careful risk assessment. Understanding how a protocol values and secures its collateral may prove just as important as choosing which asset to invest in.