LINK is showing early signs of a bullish recovery.
A breakout above the 9-day EMA could drive price toward $8.00.
Strong fundamentals support a longer-term target around $11.00.
Chainlink’s growing adoption continues to strengthen its long-term outlook. With increasing blockchain integration in major global initiatives, the LINK market has the potential to witness significant price appreciation. At the same time, technical indicators suggest that a bullish breakout may already be underway.
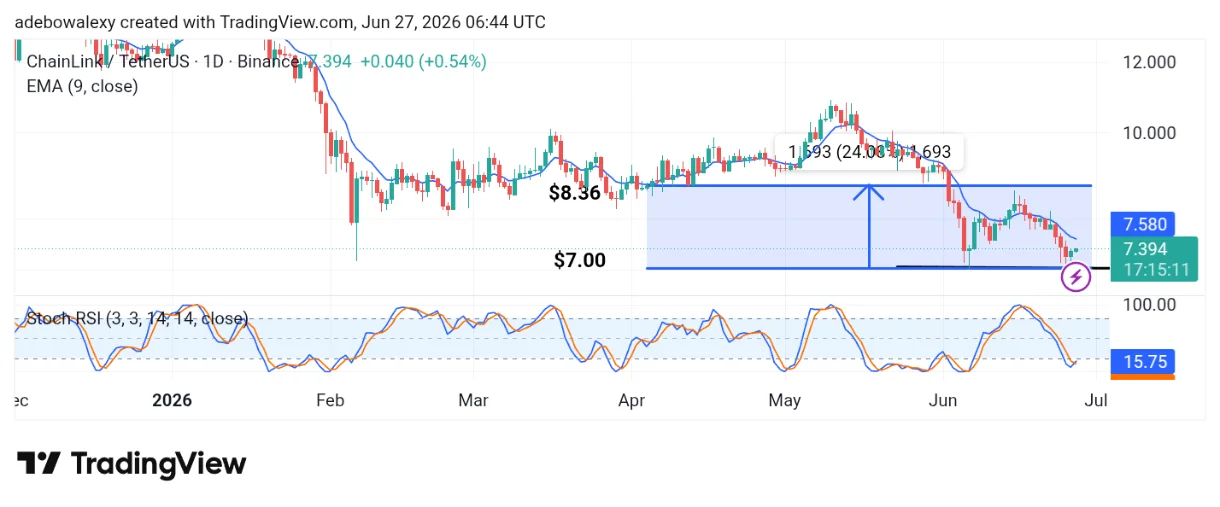
Chainlink Market on the 24-Hour Price Chart
Price action in the LINK/USDT market has formed a “W” (double-bottom) pattern, a bullish reversal formation. Since the previous session, the market has rebounded upward, and the current session has maintained that momentum. However, the token continues to trade below the 9-day Exponential Moving Average (EMA), which remains a key resistance level.
Chainlink (LINK) Positions for Price Growth. Source / Cryptosignals: TradingView
Meanwhile, the Stochastic Relative Strength Index (SRSI) has produced a bullish crossover deep within the oversold region, indicating that buying momentum is beginning to build.
Chainlink’s Latest Move Appears to Be in Its Early Stages
The recent behavior of price action suggests that LINK may be at the beginning of a bullish recovery. A “W” pattern has formed near the important support level at $7.00, signaling that buyers are attempting to regain control of the market.
Chainlink (LINK) Positions for Price Growth. Source / Cryptosignals: YouTube
Although price action remains below the 9-day EMA, which limits short-term bullish confirmation, the recent bullish crossover on the SRSI suggests that momentum is gradually improving. This indicates that a stronger upward move could develop in the near term.
Chainlink Has the Potential to Break Above $8.00
Both technical and fundamental factors continue to support a bullish outlook for Chainlink. The emerging breakout pattern, combined with growing adoption of the Chainlink blockchain and ecosystem, provides a solid foundation for further price appreciation.
As a result, the $8.00 level appears to be within reach. If bullish momentum continues to strengthen, the market could extend its rally toward the $11.00 region over the longer term.
Disclaimer:
Note: Cryptosignals.org is not a financial advisor. Do your research before investing your funds in any financial asset, product, or event. We are not responsible for your results.
If there were a primary mechanical task that traders undertake to be profitable, it would be seeking an edge. They study indicators, optimise position sizing, experiment with entries, and spend endless hours refining their systems. Yet one of the most powerful upgrades costs nothing.
It is a belief.
We are not talking about mindless motivational slogans or nonsense such as The Secret or trying to get the universe to manifest profitability for you.
Psychologist Albert Bandura’s work on self-efficacy showed that an individual’s belief in their ability to perform is one of the strongest predictors of eventual success. Across education, athletics, business and countless other domains, the findings have been consistent. People who believe they can perform generally outperform those who doubt themselves.
Most forms of self-improvement involve effort—it has some form of cost.
Fitness requires training.
Education requires study.
Diet requires discipline.
Trading systems require testing.
Belief, however, has almost no entry cost.
A trader who believes they can follow their process approaches markets differently from one who constantly doubts themselves. They review mistakes rather than abandon systems. They continue taking valid signals after losing streaks. They remain patient during inevitable drawdowns and maintain enough confidence to capture the occasional outlier that often determines long-term returns.
The trader who lacks belief frequently sabotages themselves before probabilities have time to work. To some degree, this is understandable as most misunderstand how trading systems function. New traders automatically assume they will be profitable from their very first trade. They don’t understand that trading systems take their losses first – this inevitably pushes the account into a drawdown. Winning positions take time to unfold.
Belief Changes Behaviour
Confidence is not merely a pleasant feeling. Belief influences action. Everything we think alters our software, which in turn influences our behaviour.
If you believe you are capable of becoming a successful trader, you are more likely to:
will unconsciously act in ways that confirm those assumptions.
They hesitate, overtrade, abandon systems, chase news, and interrupt the very process that might have worked if given sufficient time.
Their beliefs also become self-fulfilling.
Evidence Builds Confidence
It is important not to confuse belief with fantasy. People who drone on endlessly about manifesting things are locked into a fantasy. This is simply another version of wishful thinking.
Every time you enter a trade in your journal, you are collecting evidence that bolsters your belief system. The same is true each time you hold through a downturn without abandoning your system—you have anchored to the process.
Much of trading is simply being consistent, showing up each day and following your system.
If I were to break it down into a very simple flow, it would be Belief – Action – Results – StrongerBelief. Eventually, belief alters behaviour and behaviour alters outcome.
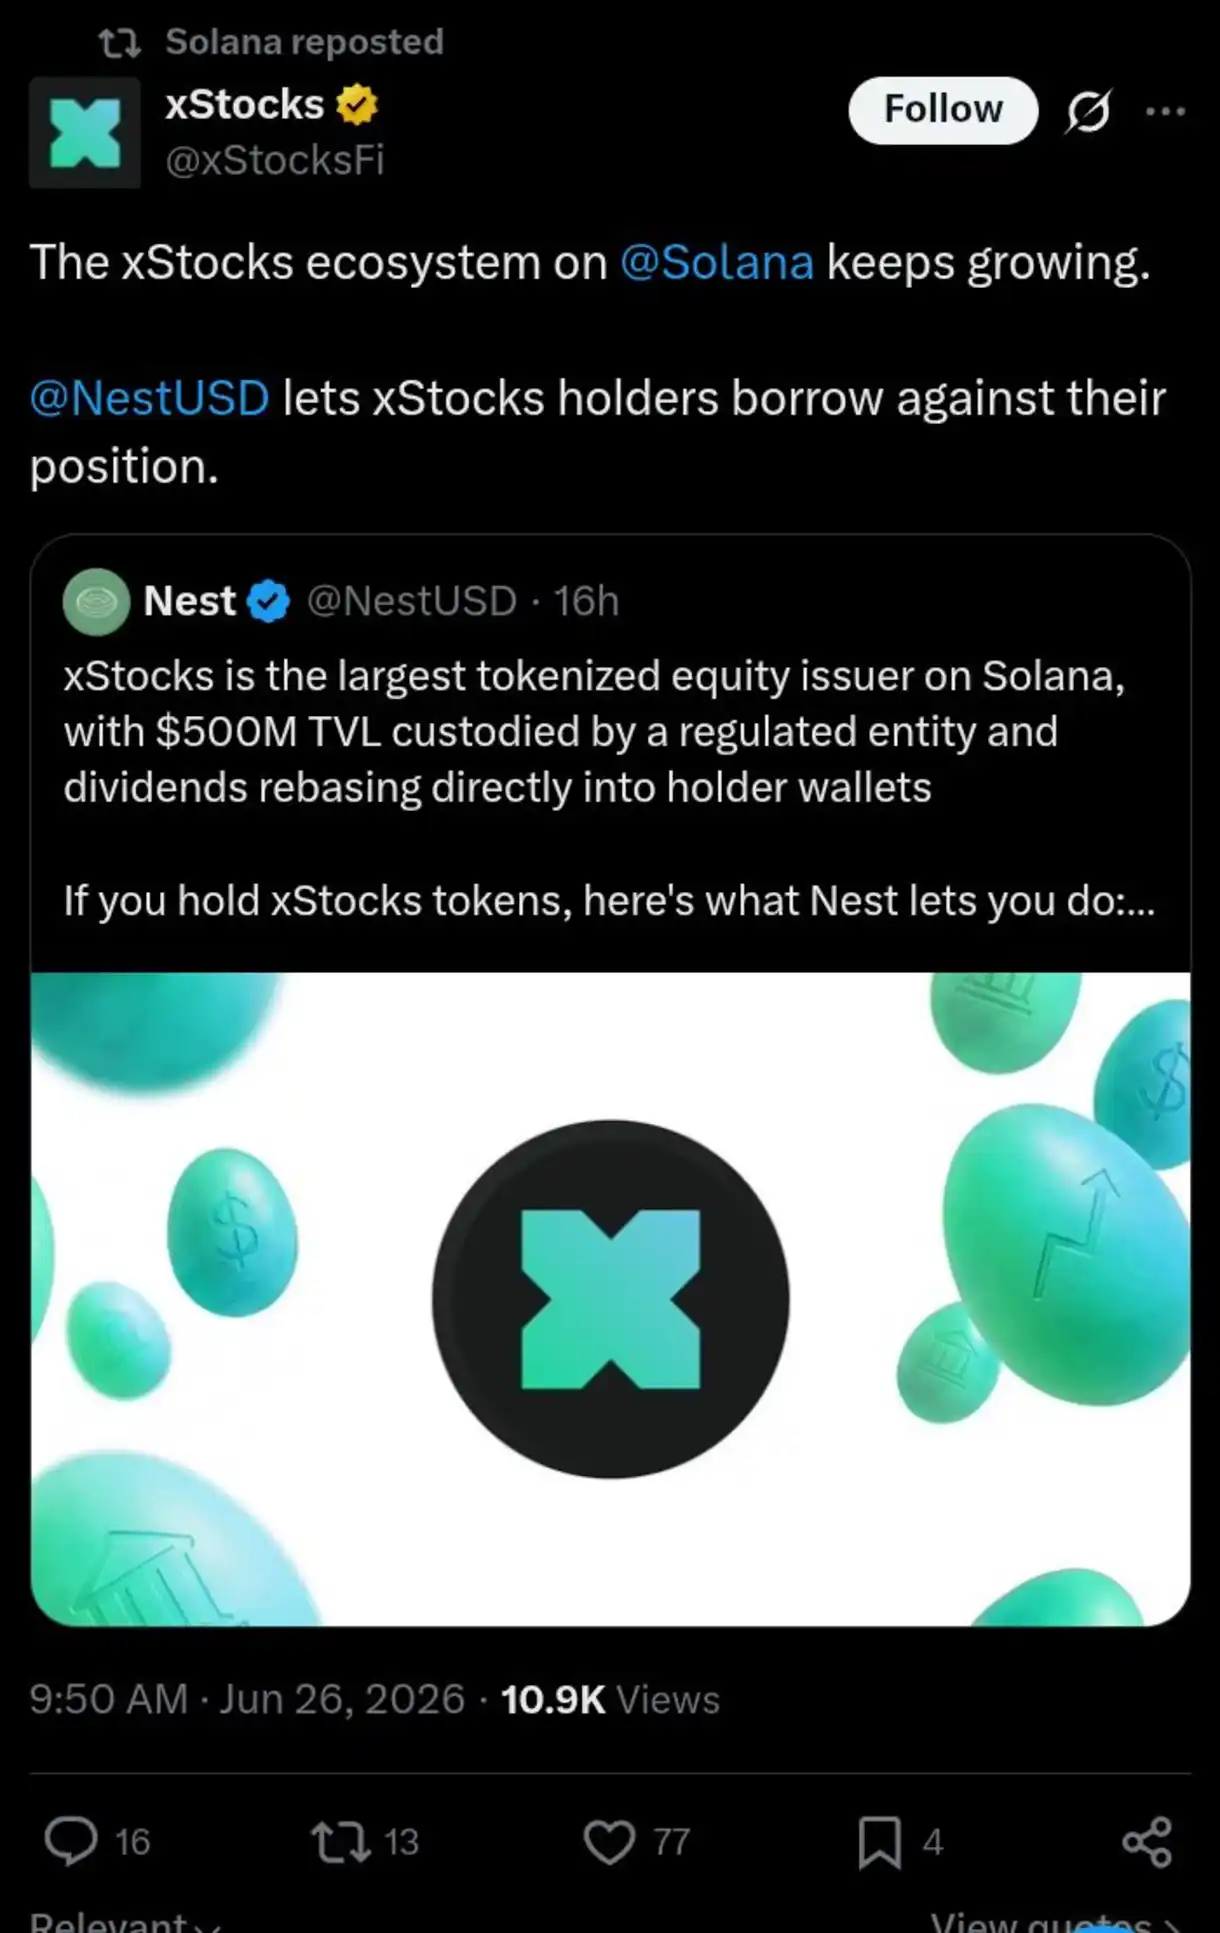
SOL is building momentum as the Solana ecosystem continues to grow.
Price is rebounding but remains below the 9-day EMA.
A break above the EMA could pave the way toward the $100 and $150 targets.
The Solana blockchain has continued to grow quietly, as reflected by the xStocks market reaching an impressive $550 million. This development has the potential to drive the price of SOL higher as more investors are attracted to the ecosystem. In addition, several technical indicators suggest that the token may be quietly building momentum for another upward move.
Taking a Look at the Solana Market on the 24-Hour Chart
The price chart shows that earlier this month, Solana briefly broke above the $70 level. However, the breakout was short-lived, as the market soon retreated below that level.
Although today’s trading session has produced a modest rebound, price action remains below the 9-day Exponential Moving Average (EMA). As of this writing, SOL is trading around the $69.85 level. Meanwhile, the Stochastic Relative Strength Index (SRSI) is beginning to turn higher, hinting at a potential bullish crossover.
Can Traders Capitalize on the Current Move?
Today’s trading activity stands out compared to the previous five sessions, during which bearish pressure consistently pushed the market lower. The current session has produced a rebound, bringing price action closer to the 9-day EMA.
Likewise, the SRSI lines have started to curve upward, suggesting improving momentum. However, this rebound may only provide short-term support, as the market has yet to break above the 9-day EMA, which remains an important technical hurdle.
Solana May Require More Patience
Although today’s bullish session is encouraging, traders may still need to exercise patience. Price action remains below a key technical resistance, making a decisive move above the 9-day EMA essential for confirming a stronger short-term recovery.
At the same time, the SRSI is attempting a bullish crossover after entering the oversold region, indicating that momentum may continue to improve. Consequently, traders may prefer to wait for a confirmed break above the 9-day EMA before targeting higher prices in the short term.
From a longer-term perspective, however, Solana’s growing ecosystem continues to support a bullish outlook. As a result, traders may keep the $100 and $150 price levels in view as long-term upside targets.
Disclaimer:
Note: Cryptosignals.org is not a financial advisor. Do your research before investing your funds in any financial asset, product, or event. We are not responsible for your results.
Crypto payments mirror early e-commerce, says Ripple executive.
Stablecoins and infrastructure are driving adoption.
Crypto’s long-term potential may be underestimated.
Twenty-five years ago, buying anything online sounded risky. Many people refused to enter their credit card details on websites, believing internet shopping was a fad. Today, more than one out of every five retail dollars is spent online. Ripple executive Reece Merrick believes crypto payments are standing at a similar turning point.
The Digital Evolution: Mirroring the Early Internet Stage
To understand where cryptocurrency is today, we only need to look back at the internet in 2000. At the turn of the millennium, e-commerce was met with deep skepticism. Internet speeds were painfully slow, payment gateways were in their infancy, and the concept of smartphones didn’t even exist. Because the infrastructure was clunky and unfamiliar, the average person simply didn’t trust online payments, and traditional merchants rarely bothered to sell online.
Crypto coins on the table. Source: cryptosignals / create.vista.com
Today, cryptocurrency is navigating that exact same maturity curve. For many users, managing digital wallets still feels confusing and intimidating, while global regulatory frameworks are still evolving to catch up with the tech.
However, just like the early web, the foundational infrastructure is rapidly improving behind the scenes. Businesses are steadily integrating digital assets into their models, and the rise of stablecoins is finally providing a practical, stable bridge for everyday use. What feels complex today is simply the groundwork being laid for tomorrow’s mainstream adoption
The Hidden Lesson: Bet on the Builders
The most critical takeaway from the internet revolution is often the most overlooked: the ultimate winners weren’t the flashy, first-generation websites. Instead, the real fortunes were made by the companies that built the invisible infrastructure making the ecosystem viable.
E-commerce couldn’t truly thrive until broadband internet and smartphones made connectivity seamless, while payment processors, cloud computing, and advanced logistics networks made global commerce secure and reliable.
Today, crypto is quietly undergoing the exact same foundational shift. The future giants won’t just be the speculative tokens but the entities building the plumbing of the new financial system.
We are seeing this happen in real-time through the rapid rise of stablecoins and Layer-2 scaling networks that make transactions cheap and fast. Combined with user-friendly wallets, regulated exchanges, robust compliance tools, and seamless cross-border payment systems, the critical infrastructure is finally locking into place to support mass adoption.
Reece Merrick comparing the current stage of crypto to the early stage of e-commerce.Source: cryptosignals / X
Investors should watch whether the infrastructure continues improving. Infrastructures such as
merchant adoption
stablecoin growth
payment integrations
easier user experiences
clearer regulations
Those factors could determine whether crypto payments follow the same trajectory as online shopping. At the same time, it’s important to note that Merrick’s view is a forward-looking opinion rather than a certainty.
Key Takeaway
History shows that transformative technologies often spend years looking unimpressive before reaching mainstream adoption. Whether crypto payments repeat the e-commerce story remains uncertain, but the comparison reminds investors to pay attention not only to prices but also to the infrastructure quietly being built beneath the surface.
Note: Cryptosignals.org is not a financial advisor. Do your research before investing your funds in any financial asset, product, or event. We are not responsible for your results.
Overleveraged traders often fuel crypto liquidation cascades.
ETF flows, market sentiment, and technical breakdowns can accelerate selloffs.
Funding rates and open interest help investors spot rising liquidation risks.
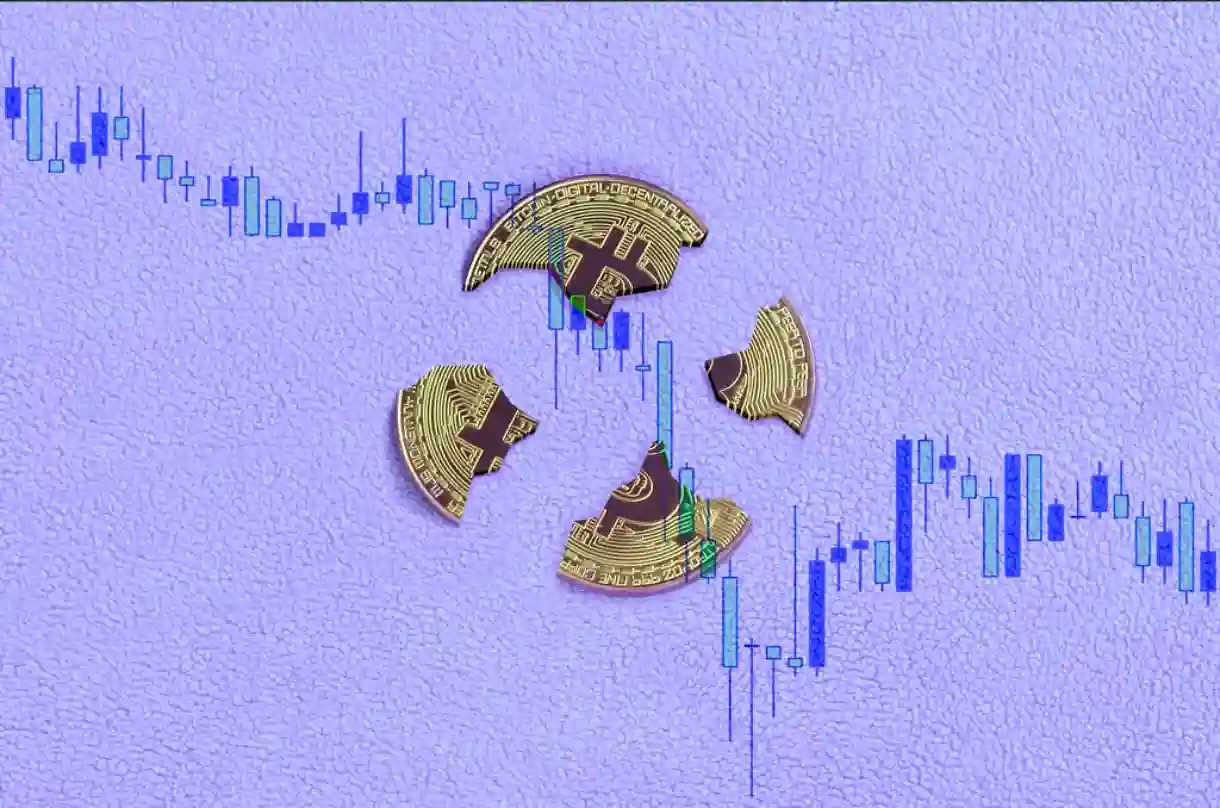
Billions of dollars were wiped from the crypto market in a matter of hours as Bitcoin’s decline triggered a wave of forced liquidations. But the real story isn’t the price drop itself—it’s what caused it.
What Causes Massive Liquidations?
Massive liquidations rarely occur because of a single event. More often, they result from a combination of market conditions that amplify selling pressure and force leveraged traders out of their positions.
Overleveraged Traders
Excessive leverage is a primary driver of large-scale liquidations. While borrowing funds magnifies crypto profits, it equally amplifies risk. When prices move against leveraged positions, exchanges automatically close them to prevent further losses.
The higher the leverage, the smaller the price shift needed to trigger a liquidation.
Cascade Liquidations
Liquidations can quickly snowball into a chain reaction. When initial leveraged positions close, forced selling drives prices down. This decline triggers further liquidations, creating a self-reinforcing cycle. As the cascade intensifies, market volatility spikes, often wiping billions from the market within hours.
Downturn in the price of Bitcoin. Source: cyrptosignals/create.vista.com
ETF Flows
Spot Bitcoin ETFs significantly drive market trends. While strong inflows support prices, slowing institutional demand or outflows weaken buying pressure. This vulnerability easily triggers market corrections, particularly when leveraged bullish positions are high.
Macroeconomic Uncertainty
Crypto markets don’t operate in isolation. Macroeconomic factors—like inflation, interest rates, geopolitics, and shifting sentiment—directly impact demand for risk assets.
During periods of uncertainty, investors de-risk, increasing selling pressure and raising the likelihood of liquidations.
Technical Support Breakdowns
Breaking key technical support levels often triggers panic, stop-losses, and algorithmic selling. This forced momentum drives leveraged positions into liquidation, sparking a cascade.
Ultimately, regardless of the specific trigger, every major crypto selloff follows the same pattern: a mix of excessive leverage, dropping demand, and market uncertainty.
What It Means for Investors
While massive liquidation events can be painful to watch, they also offer important lessons for both new and experienced investors. Understanding how these market dynamics work can help traders manage risk more effectively and make better-informed decisions during periods of volatility.
Why Leverage Amplifies Risk
Leverage amplifies both gains and losses by letting traders control large positions with minimal capital. In highly leveraged trades, a tiny price drop can trigger liquidation, wiping out a trader’s entire margin. Consequently, investors should avoid excessive leverage, especially during high market uncertainty.
Why Liquidations Create Both Opportunities and Dangers
While mass liquidations trigger panic and losses for unprepared investors, they offer disciplined buyers a window to accumulate quality assets at deep discounts. Success depends entirely on distinguishing temporary, forced selling from a true market reversal.
Why Investors Should Watch Funding Rates and Open Interest
Two key metrics signal market vulnerability to liquidations: funding rates and open interest. Extremely positive funding rates show overleveraged bullish sentiment, raising the risk of a long liquidation cascade.
Meanwhile, rapidly rising open interest alongside climbing prices indicates growing market leverage. Monitoring these metrics helps investors assess market positioning and spot hidden liquidation risks before they erupt.
Key Takeaway
Ultimately, massive liquidations serve as a reminder that risk management is just as important as profit potential. In the crypto market, preserving capital during periods of extreme volatility often proves more valuable than chasing short-term gains.
Market crashes are often less about bad news and more about crowded positions. When too many traders bet on the same outcome using borrowed money, even a modest decline can trigger a chain reaction of liquidations.
Note: Cryptosignals.org is not a financial advisor. Do your research before investing your funds in any financial asset, product, or event. We are not responsible for your results.
TRX remains stronger than much of the crypto market.
Short-term bearish pressure is increasing.
$0.3000 is key support; $0.4000 remains a target.
The overall cryptocurrency market has declined significantly in 2026. Even Bitcoin has experienced a substantial pullback from its October high. Despite these challenging conditions, Tron has recorded a price gain of approximately 13.5% this year. Furthermore, the token has risen by more than 2% today alone, highlighting its relative strength compared to many other cryptocurrencies.
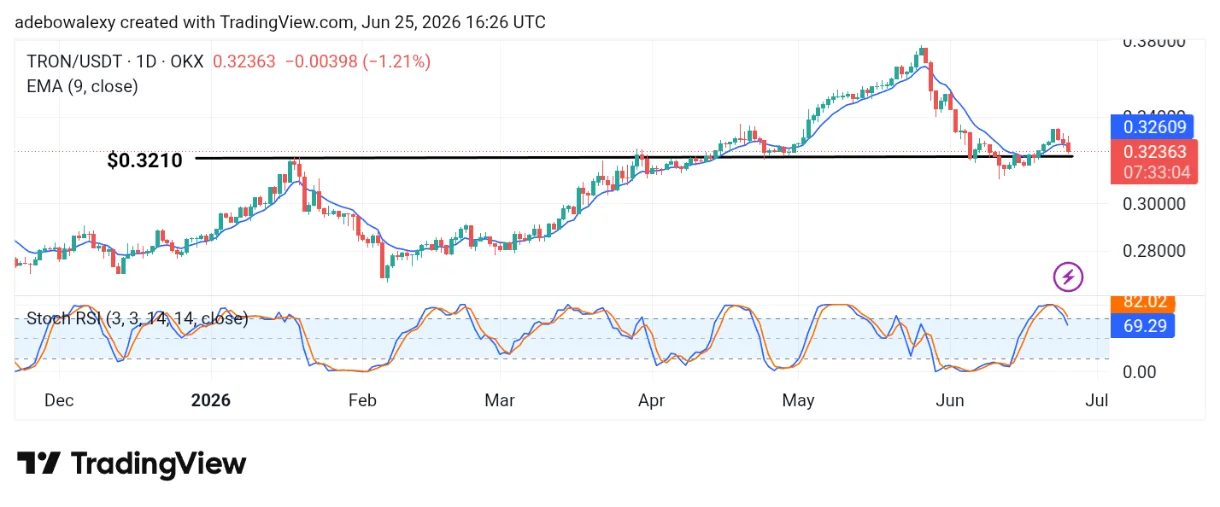
Tron Market on the 24-Hour Chart
While Tron has performed well according to available metrics, its price chart suggests that bearish pressure has recently emerged. Over the past two sessions, the market has moved lower, as reflected by the corresponding price candles.
Tron (TRX) Continues to Outperform the Broader Crypto Market. Source / Cryptosignals : Image Via TradingView
The current session has seen the market slip below the 9-day Exponential Moving Average (EMA), although it remains above the key support level at $0.3210. Meanwhile, the Stochastic Relative Strength Index (SRSI) is trending downward toward the 60 level, indicating weakening bullish momentum.
Will TRX Maintain Its Long-Term Bullish Outlook?
From a longer-term perspective, the Tron market continues to maintain a bullish structure. This view is supported by the fact that price action remains above the important support level at $0.3210.
However, in the short term, bearish momentum appears to be gaining influence. Price action has fallen below the 9-day EMA, while the SRSI has turned downward after previously reaching overbought territory. These signals suggest that the market may experience additional short-term weakness.
Tron (TRX) Continues to Outperform the Broader Crypto Market. Source / Cryptosignals : Image Via YouTube
Tron Market Remains Promising
Despite the current bearish short-term outlook, the broader uptrend may remain intact. Tron continues to show resilience at a time when much of the cryptocurrency market is under pressure.
As a result, traders may monitor the $0.3000 level as a key psychological support. A break below this level could signal deeper declines. However, if support holds, the longer-term bullish trend could resume, potentially driving the market toward the $0.4000 level and beyond.
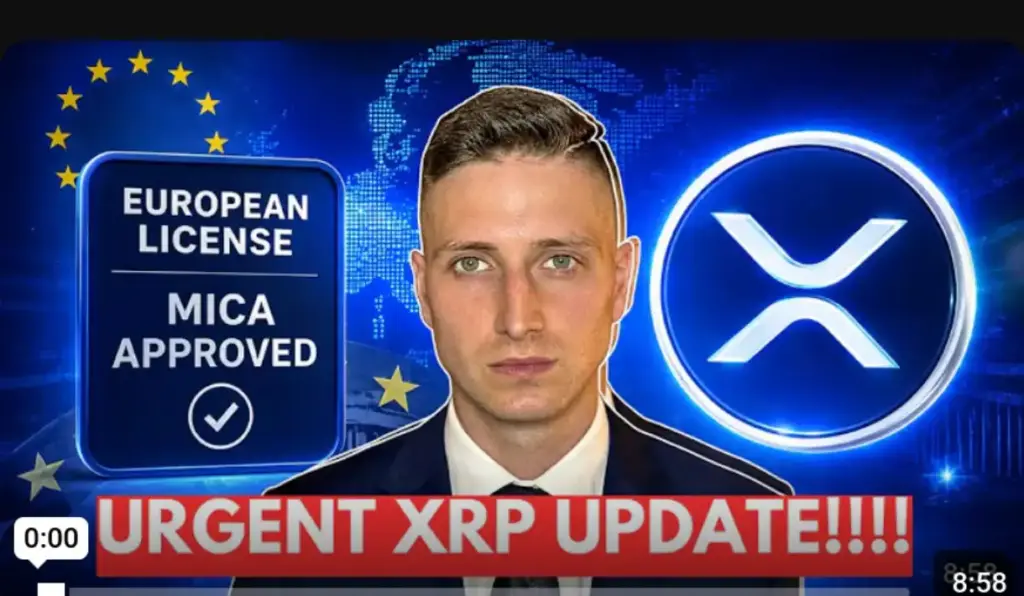
Ripple receives preliminary MiCA approval from Luxembourg’s regulator.
Full CASP license could unlock crypto services across 30 EEA countries.
Approval comes just ahead of the EU’s July 1 MiCA compliance deadline.
Ripple has taken a major step toward expanding its presence across Europe after securing preliminary approval for a Crypto Asset Service Provider (CASP) license under the European Union’s Markets in Crypto-Assets (MiCA) framework.
The approval, issued by Luxembourg’s financial regulator, the Commission de Surveillance du Secteur Financier (CSSF), comes in the form of a “Green Light Letter.” While it is not yet a final authorization, it signals that Ripple has satisfied the regulator’s key requirements and is on track to obtain full licensing once the remaining conditions are met.
Ripple digital money. Source: cryptosignals/create.vista.com
What the Approval Means
If Ripple receives final approval, the company will be able to offer regulated crypto services throughout the European Economic Area (EEA), which includes all 27 EU member states plus Iceland, Liechtenstein, and Norway.
The license would allow Ripple to provide cryptoasset and stablecoin payment solutions to banks, fintech firms, and corporate clients through a single regulatory framework. More importantly, the authorization would be “passportable,” meaning Ripple could operate across multiple European markets without needing separate licenses in each country.
This could significantly simplify expansion efforts and strengthen Ripple’s position as a regulated provider of blockchain-based payment services.
Strategic Timing Ahead of MiCA Deadline
The development arrives just before MiCA’s July 1 compliance deadline, a milestone that will require crypto companies operating in the EU to meet the bloc’s new regulatory standards or cease serving customers in the region.
As a result, firms that obtain MiCA approval early may gain a competitive advantage over rivals still navigating the licensing process.
Ripple’s progress places it among a relatively small group of crypto companies moving toward full MiCA compliance, reinforcing its long-standing strategy of working closely with regulators rather than operating in uncertain legal environments.
Ripple already holds an Electronic Money Institution (EMI) license in Luxembourg. When combined with a finalized CASP license, the company would be positioned to offer a broader suite of regulated payment and digital asset services across Europe.
The dual-licensing structure could make Ripple an attractive partner for financial institutions seeking compliant access to crypto payments, tokenized assets, and stablecoin infrastructure.
Why It Matters
Europe is quickly emerging as one of the most regulated and institution-friendly crypto markets in the world. As MiCA reshapes the industry’s regulatory landscape, companies that secure early approval are likely to be viewed as safer and more reliable partners by banks and enterprises.
For Ripple, the CSSF’s preliminary approval is more than a regulatory milestone—it is a strategic gateway to one of the world’s largest financial markets. If the final authorization is granted, the company could significantly expand its reach across Europe while strengthening confidence in its crypto and stablecoin payment ecosystem.
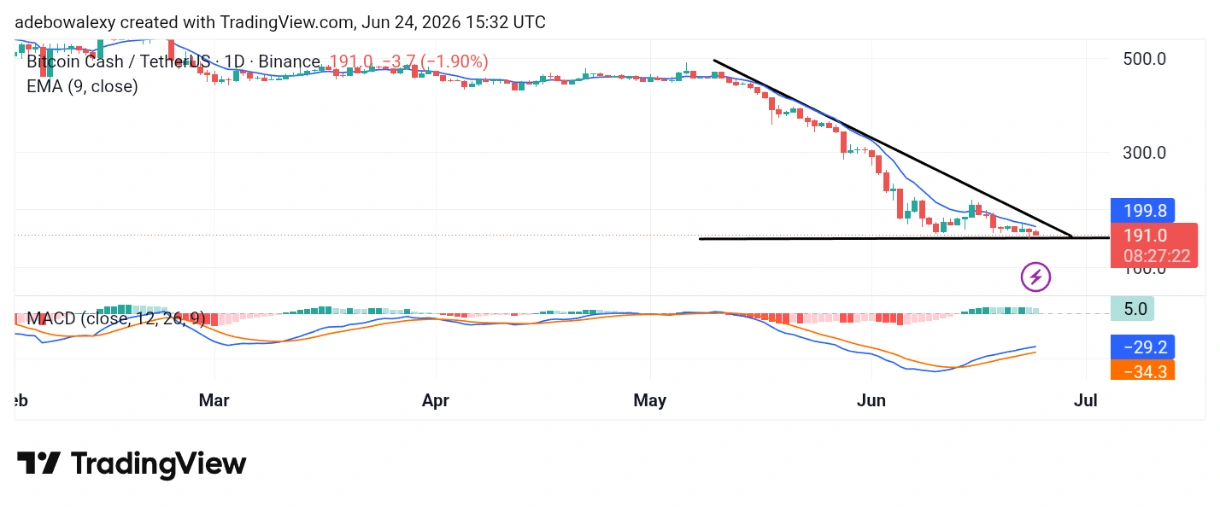
BCH is forming a pattern that suggests a potential breakout.
MACD signals are improving despite price remaining below the 9-day EMA.
Long-term targets remain in the $300–$400 range.
Bearish momentum in the Bitcoin Cash market appears to remain significant. However, price action also seems to be approaching a bottom. As a result, the market is forming a pattern that suggests a potential breakout may occur soon. Overall, the cryptocurrency market appears to be at a critical stage.
Bitcoin Cash (BCH) Seems to Be Bottoming Out; A Breakout May Occur Soon. Source / Cryptosignals : Image Via YouTube
The Bitcoin Cash Market on the Daily Chart
As mentioned earlier, price action in the BCH market appears highly compressed. Unlike previous downward movements, the market is no longer forming lower lows at the same pace. Instead, price action has developed into a falling wedge pattern, which is often considered a bullish reversal formation.
Despite this, trading activity remains below the 9-day Exponential Moving Average (EMA). Meanwhile, the Moving Average Convergence Divergence (MACD) indicator remains below the equilibrium level, although its lines have begun to slope upward. In addition, the histogram bars have moved into positive territory, albeit with relatively weak momentum, as indicated by their pale green color.
BCH Bulls May Be Applying the Brakes
Although price action suggests that bearish pressure may be easing, traders should remain cautious. Given the current chart pattern, however, an upward breakout appears increasingly likely.
Bitcoin Cash (BCH) Seems to Be Bottoming Out; A Breakout May Occur Soon. Source/ Cryptosignals : Image Via TradingView
The falling wedge formation suggests bullish momentum could soon take control of the market, triggering a breakout. The MACD indicator also lends some support to this outlook, as its lines continue to trend upward below the equilibrium level. While the strength of any resulting rally remains uncertain, the possibility of a meaningful rebound continues to grow.
What May Happen Next in the Bitcoin Cash Market
The technical signs appear to be aligning in favor of a breakout. However, traders should note that price action remains below the 9-day EMA, suggesting that it may still be too early to adopt an aggressive short-term bullish stance.
Nevertheless, stronger upward movements could emerge in the near future. As a result, traders may consider approaching the market with a longer-term bullish outlook, targeting the $300 to $400 price range.
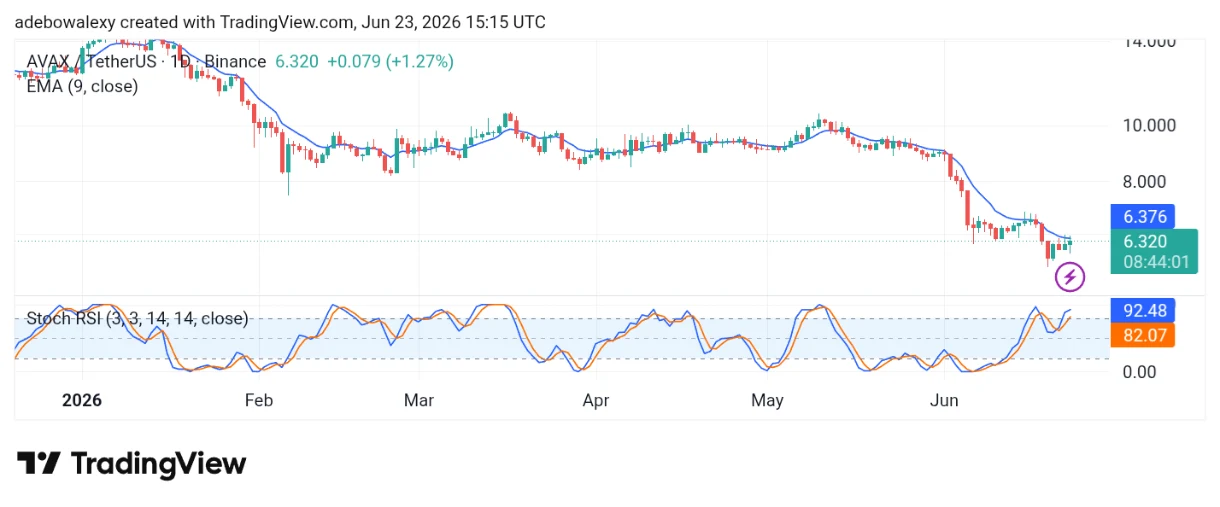
AVAX remains under pressure and is trading below the 9-day EMA.
Technical indicators suggest further short-term downside is possible.
Continued accumulation may support a strong rebound toward $70–$80.
While the Avalanche market may appear unattractive at the moment, indicators such as money inflow suggest that the token is currently being accumulated. Although prices may decline slightly further, an upward rebound appears increasingly likely in the near term.
Avalanche (AVAX) Heads for a Strong Rebound. Source / Cryptosignals : Image Via YouTube
Studying the Avalanche Market on the Daily Chart
On the daily chart, price action is trading near its lowest level since early June. Recently, the market has shown signs of recovery, although bullish momentum remains weak. Despite the slight upward movement, price action remains below the 9-day Exponential Moving Average (EMA).
The current session’s candle reflects modest gains. Meanwhile, the Stochastic Relative Strength Index (SRSI) has risen into the overbought region, suggesting that momentum remains mixed.
Avalanche May Slip Lower Before Rebounding
At present, price action in the AVAX market remains under pressure. As a result, the market could experience further downside before a meaningful recovery begins. The ongoing session shows an attempt to reclaim key technical levels; however, bullish momentum remains insufficient, with trading still below the 9-day EMA.
Avalanche (AVAX) Heads for a Strong Rebound. Source / Cryptosignals : Image Via TradingView
In addition, the SRSI indicator remains in overbought territory, while its lead line has begun to flatten and curve downward, suggesting that bearish pressure is still influencing price action. This trend is occurring even as accumulation continues in the background.
Cash Inflow into the Avalanche Market Maintains a Latent Effect
Despite continued buying activity, AVAX price action remains bearish in the short term, as confirmed by current technical indicators. Consequently, traders may anticipate additional downside movement before a reversal occurs.
However, the sustained inflow of capital into the market suggests that a bottom may be forming. If accumulation continues, it could lay the foundation for a strong bullish rebound, potentially driving AVAX toward $70 and even $80 over the longer term.