Avalanche Price Forecast: AVAXUSD Struggles to Overcome Resistance at $13.40
Estimated Reading Time: 2 minutes
Don’t invest unless you’re prepared to lose all the money you invest. This is a high-risk investment and you are unlikely to be protected if something goes wrong. Take 2 minutes to learn more
Avalanche Price Forecast: July 6
The Avalanche price forecast is for the market to return to the support level before it attempts again to break the $13.40 resistance zone.
Avalanche Long-Term Trend: Bullish (1-Day Chart)
Key Levels:
Zones of supply: $14.20, $21.50
Zones of Demand: $10.60, $8.00

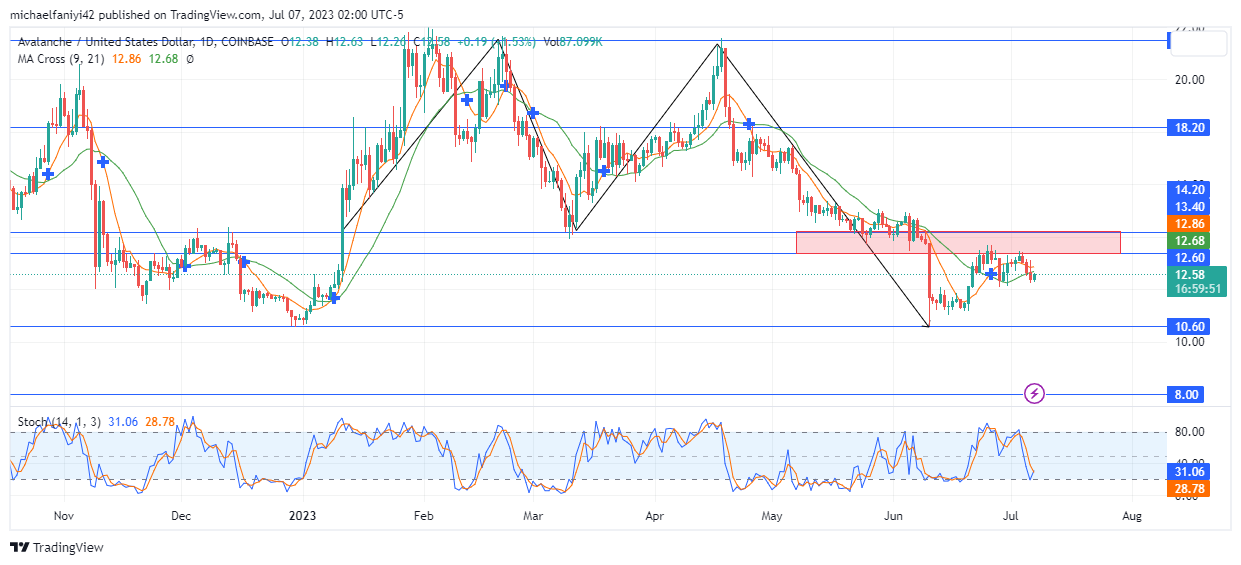
Avalanche has dropped to the $10.60 support level as a result of a bearish operation in which the market formed into a double-top bearish reversal formation and dumped the price from $21.50. After the exhaustion of the sellers, buyers have an opportunity to stamp their influence but face a battle at $13.40.
Avalanche Price Forecast: AVAX/USD Outlook
The sellers were able to effectively end the bullish reign using a double-top bearish reversal formation. Therefore, the price plummeted from the $21.50 resistance level to $10.60.
At $10.60, the sellers are exhausted, leaving the bulls active in the market. The price has begun to rise but has found a strong limitation at $13.40.
The coin is now likely to drop back to support before another rally. The MA Cross has barely crossed upward but is now receiving a different signal, causing it to cross downward due to the price drop.
AVAX/USD Medium-Term Trend: Bullish (4-hour chart)
The Stochastic Oscillator lines on the daily chart are already heading toward the oversold region. On the 4-hour chart, the lines have dropped to the oversold border. This signals an incoming drop in the price back to $10.60.

Furthermore, the MA Cross lines on the 4-hour chart have crossed downward. The Stochastic Oscillator lines on the 4-hour chart differ a little in that they have plunged into the oversold region and are now rising back toward the middle line.
How To Buy Lucky Block
Note: Learn2.trade is not a financial advisor. Do your research before investing your funds in any financial asset or presented product or event. We are not responsible for your investing results.