Synthetix (SNXUSD) Remains in an Accumulation Phase as Bears Dominate
Estimated Reading Time: 2 minutes
Don’t invest unless you’re prepared to lose all the money you invest. This is a high-risk investment and you are unlikely to be protected if something goes wrong. Take 2 minutes to learn more
SNXUSD Analysis – Price Remains in Consolidation as Bears Take Over
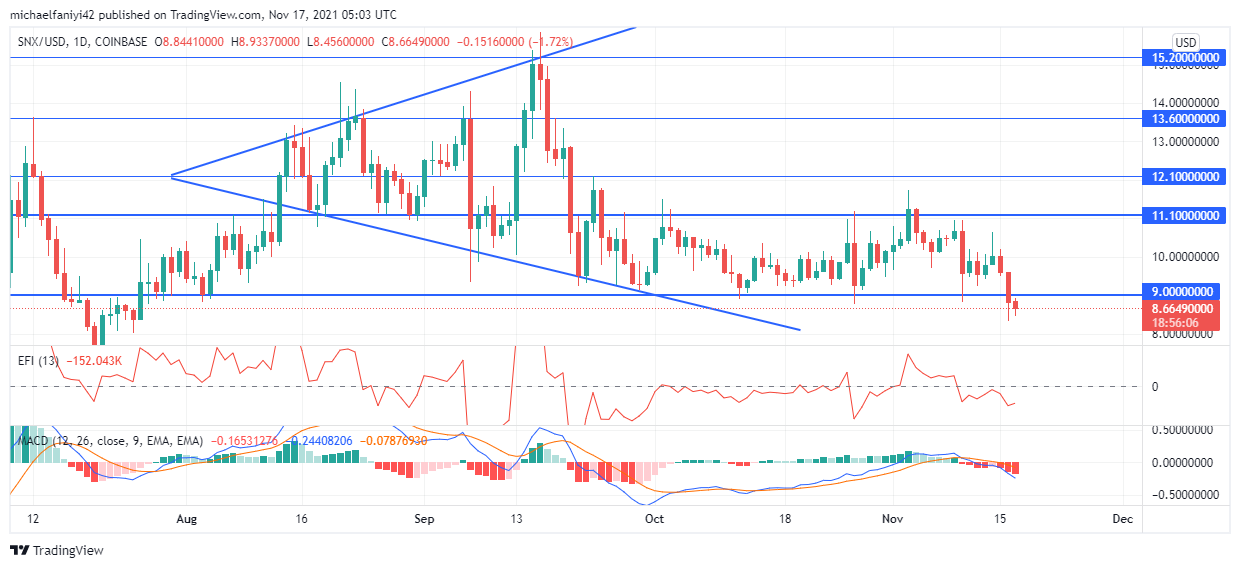
SNXUSD remains in accumulation with neither bulls nor bears finding a way through, but overall, the bears have an upper hand. The market was more or less silent after price failed to break upward on the 1st of October. This continued till the 26th of October, with bulls making a thrusting move that failed. Bears responded similarly, and there has since been much agitation in the market.
SNXUSD Key Zones
Resistance Levels: $11.100, $12.100
Support Levels: $9.000, $7.3000
The agitation from the bulls and bears can be traced back to the 14th of August when bears decided to cut short the price rally from the $7.300 key level. What followed was a back-and-forth movement in the market that shaped the candlesticks to confirm an expanding triangle pattern. This trend continued vigorously till the 23rd of September, when bulls tire out, allowing sellers to trap the price in a smaller consolidation zone.
The consolidation was between the $11.100 and $9.000 significant levels, and price accumulation has now lasted for around two months and a half. Currently, bears have made a downward push from the consolidation as they seek to bring the price even lower. The EFI (Elders Force Index), which has hitherto been reacting around the zero level, has plunged to show a current bearish influence. The MACD (Moving Average Convergence Divergence) has also crossed downward, and the bearish histogram bars are increasing.

Market Expectations
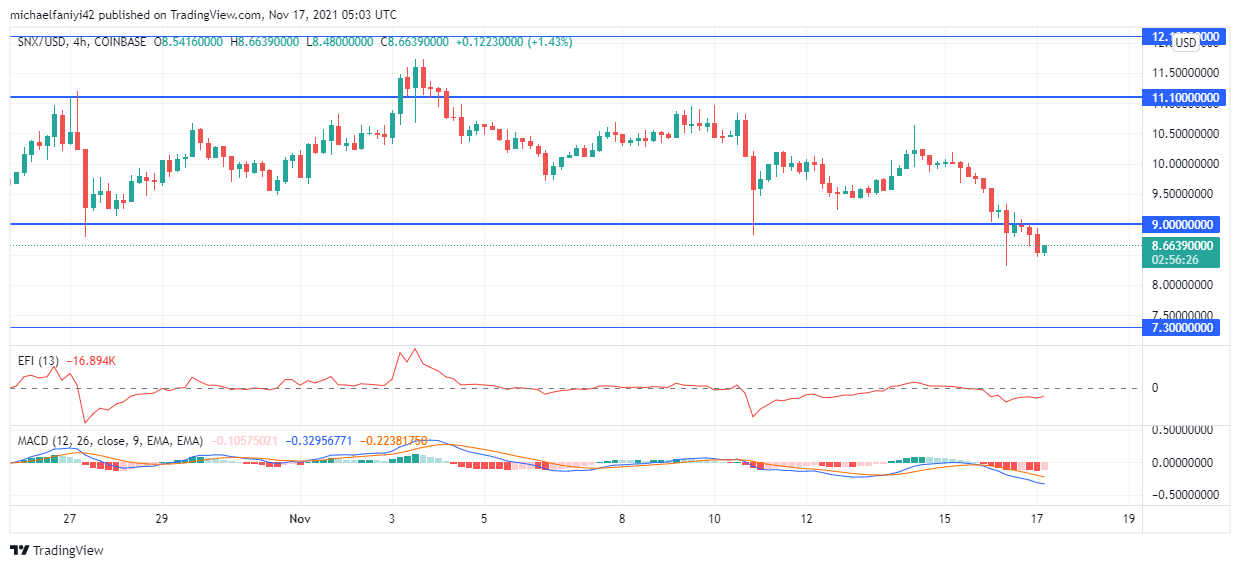
Having broken through the lower border of the consolidation zone, the coin might pull back for a retest at the border. This would be a signal for more bearish movement. The MACD indicator on the 4-hour chart aligns with that of the daily chart in that it has crossed in a downward direction with increasing bearish histogram bars. The power line of the EFI remains negative but close to the middle line. The $7.300 key level is in view.
You can purchase crypto coins here: Buy Tokens
Note: Cryptosignals.org is not a financial advisor. Do your research before investing your funds in any financial asset or presented product or event. We are not responsible for your investing results.