Avalanche Price Prediction: AVAX/USD Price Could Slide Below $12 Low
Estimated Reading Time: 3 minutes
Don’t invest unless you’re prepared to lose all the money you invest. This is a high-risk investment and you are unlikely to be protected if something goes wrong. Take 2 minutes to learn more
Quant Price Prediction – June 25
The Avalanche price prediction reveals that AVAX may head to the downside as the dip is likely to get worse.
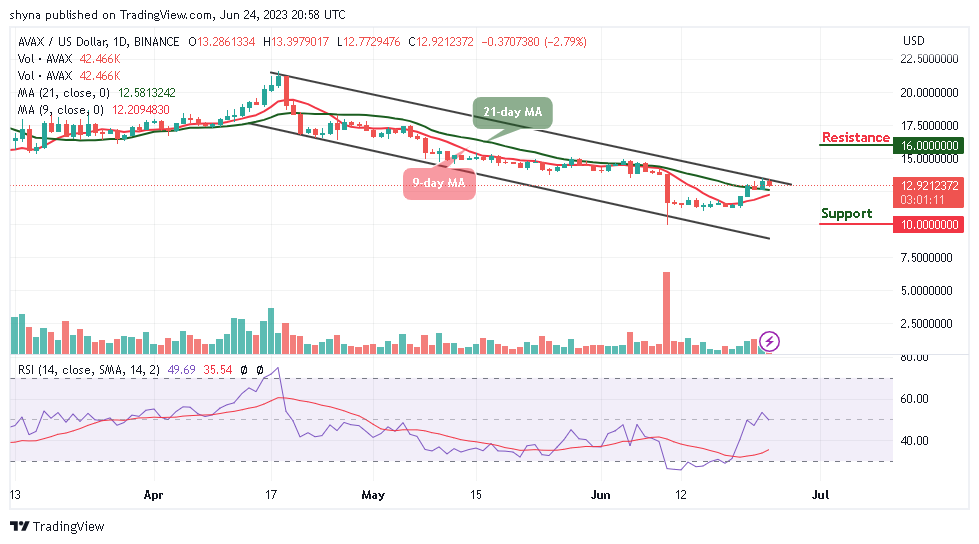
AVAX/USD Market
Key Levels:
Resistance levels: $16, $17, $18
Support levels: $10, $9, $8
AVAX/USD may not be able to follow the bullish movement at the moment as the coin heads toward the 9-day and 21-day moving averages. The Avalanche price is currently trading at $12.92, which could face a downside if it crosses below the 9-day moving average.
Avalanche Price Prediction: AVAX/USD May Head to the South
The Avalanche price is moving bearishly, and any bearish movement below the 9-day and 21-day moving averages may increase the short-term selling pressure while the critical supports may come around $10, $9, and $8. Meanwhile, any bullish movement above the upper boundary of the channel may hit the next resistance levels at $16, $17, and $18.
However, the technical indicator could start a new bearish session as the Relative Strength Index (14) heads toward the 50-level. It is, however, not clear how long the session will last because, in the last few weeks, both bullish and bearish sessions have been frequent. Therefore, it is important to watch the resistance and support levels coupled with the movement of other indicators within the daily chart.
AVAX/USD Medium-term Trend: Ranging (4H Chart)
According to the 4-hour chart, the market price is hovering below the 9-day and 21-day moving averages as the coin trades around $12.90. On the contrary, if the coin makes a cross above the moving averages, the bulls may push the price to the upside.
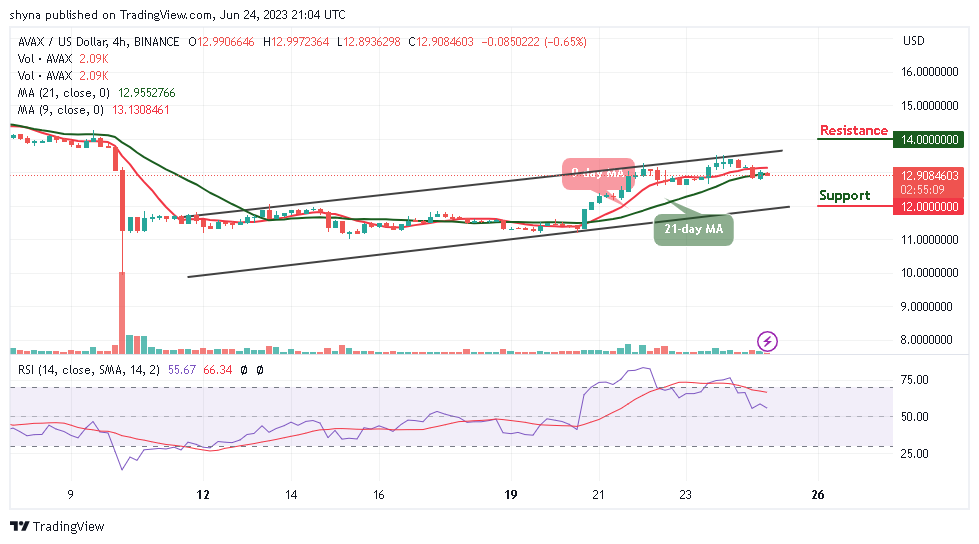
Meanwhile, if the market drops below the lower boundary of the channel, the price could hit the next key support at $12 and below. On the bullish side, a possible rise may push the market above the upper boundary of the channel which could hit the resistance level of $14 and above. As revealed by the technical indicator, the Relative Strength Index (14) may begin to follow the downward movement if the signal line moves to cross below the 50-level.
You can purchase Avalanche here. Buy AVAX