Battle Infinity Market Forecast: IBAT Is Stretching Up From the Lower Bollinger Band
Estimated Reading Time: 3 minutes
Don’t invest unless you’re prepared to lose all the money you invest. This is a high-risk investment and you are unlikely to be protected if something goes wrong. Take 2 minutes to learn more
Battle Infinity Market Forecast: November 24
Battle Infinity market forecast is that the price will gain more support and continue to rise.
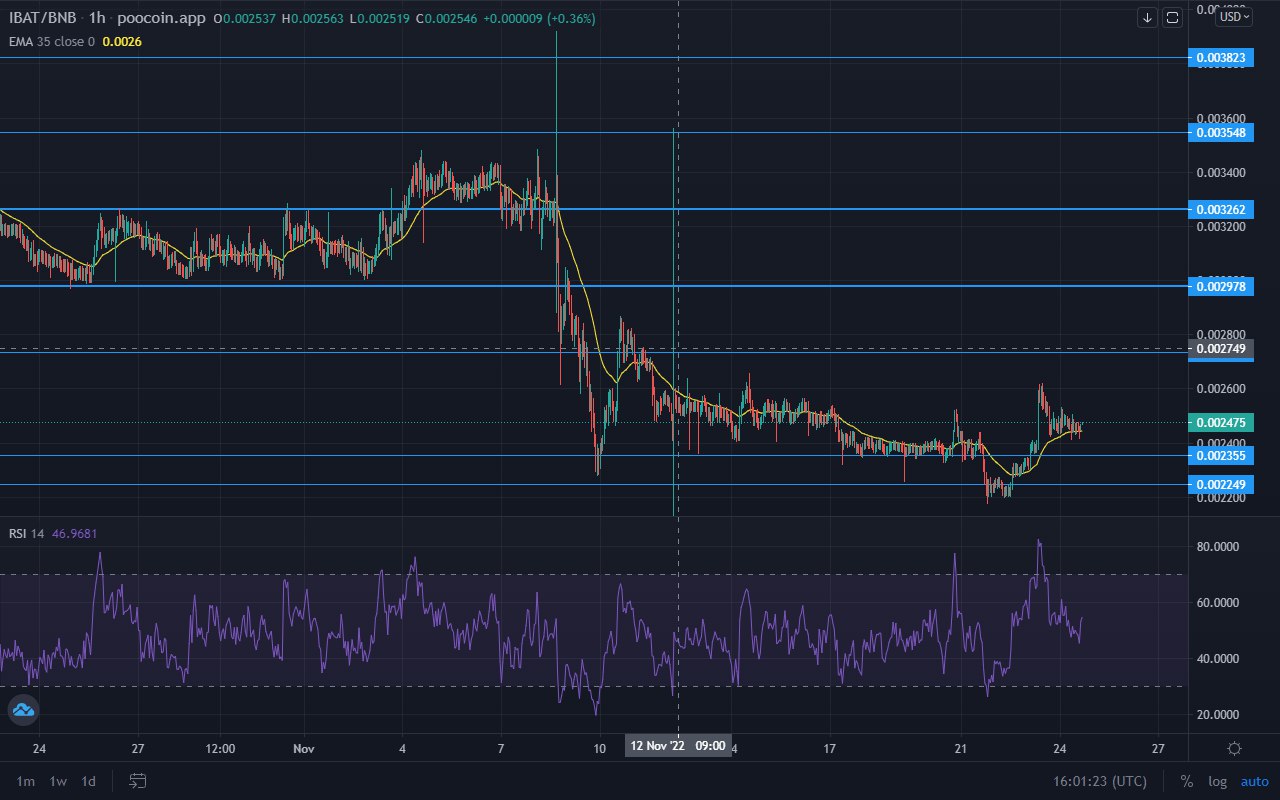
IBAT/USD Long-Term Trend: Bullish (1-Hour Chart)
Key Levels:
Supply Zones: $0.0044740, $0.0035040
Demand Zones: $0.0028780, $0.0026630
Battle Infinity has started making progress after a lot of delays. This means that the collective strength of the buyers has matched and exceeded that of the sellers. As a result, the coin has begun to make progress upward. So far, the $0.002355 key level has been breached; currently, the market is building up before ascending further to breakthrough other levels.
Battle Infinity Market Forecast: IBAT Is Strongly Bullish
Battle Infinity has managed to shrug off the weights keeping it pinned down at the $0.002249 support level. The coin has begun to rise steadily, and it has bypassed the first resistance that was posed to it.
The coin is now approaching the next resistance level at $0.002749, but just before it gets there, the market is taking some time to build up enough strength to test the resistance.
The RSI (Relative Strength Index) line is showing some noticeable progress upward despite its pullback. The EMA period 35 (Exponential Moving Average) remains firmly below the candles as support.
IBAT/USD Medium-Term Trend: Bullish (15-minute chart)
The 15-minute chart shows the EMA period 35 moving near the candlesticks, acting primarily as support for the market. The Relative Strength Index line has dropped to the middle. This is due to the market’s decision to build up before hitting the next resistance level.
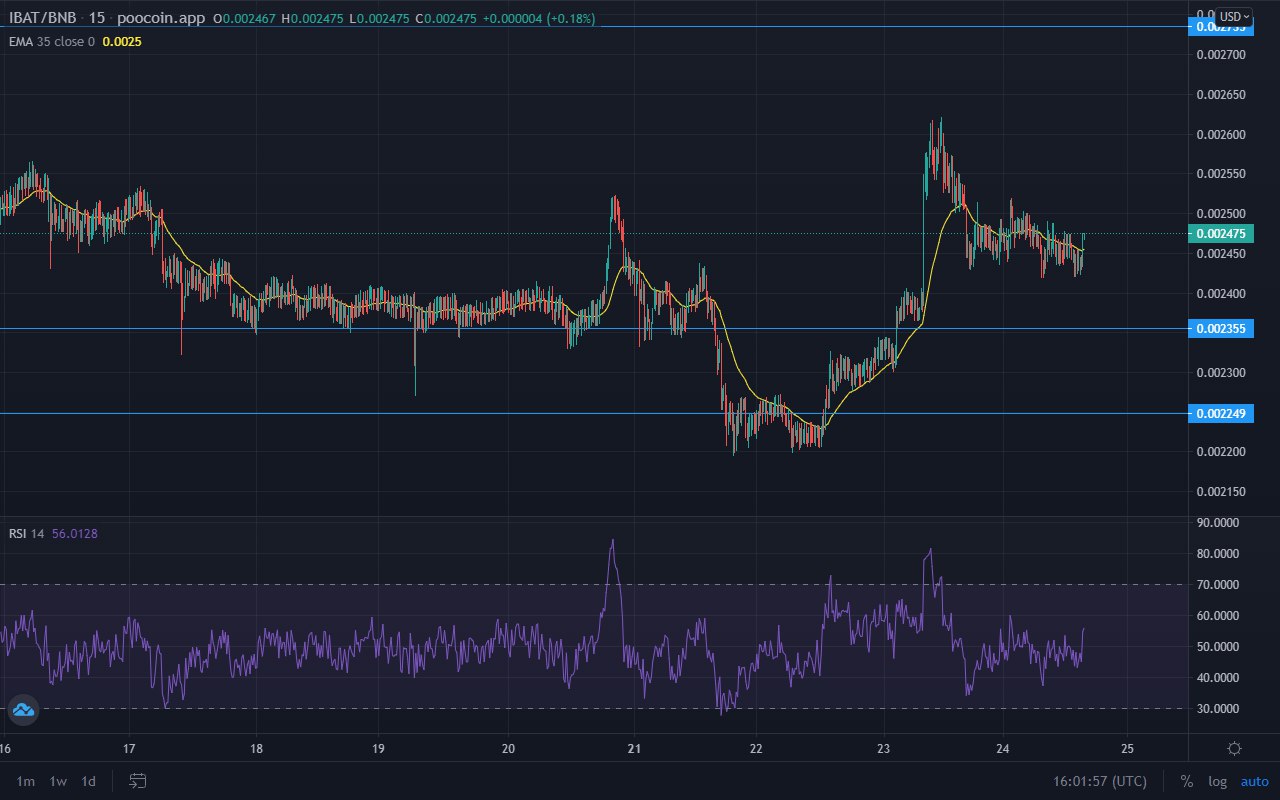
The activities of the buyers behind the scenes are expected to stir up momentum to keep the price rising. The next aim of the coin is to break through $0.002749 to continue the upward trend. The target for the market is the level at which the price spiked some weeks ago, at $0.003823.
Battle Infinity has huge potential for unusually massive returns. Buy IBAT
Note: Cryptosignals.org is not a financial advisor. Do your research before investing your funds in any financial asset or presented product or event. We are not responsible for your investing results.