Bitcoin Cash (BCH/USD) Shows Stability as Price Holds Above Mid-Band Support
Estimated Reading Time: 3 minutes
Don’t invest unless you’re prepared to lose all the money you invest. This is a high-risk investment and you are unlikely to be protected if something goes wrong. Take 2 minutes to learn more

BCH/USD Price Prediction — December 31st
Bitcoin Cash is trading around the $600.00 region after a steady rebound from the November lows. Recent price action shows the market stabilizing rather than trending impulsively. This type of behavior often signals a period of market digestion, where prior moves are being evaluated before participants decide on the next leg.
BCH/USD Market Key Levels
Resistance levels: $613.00, $650.80
Support levels: $520.10, $446.60

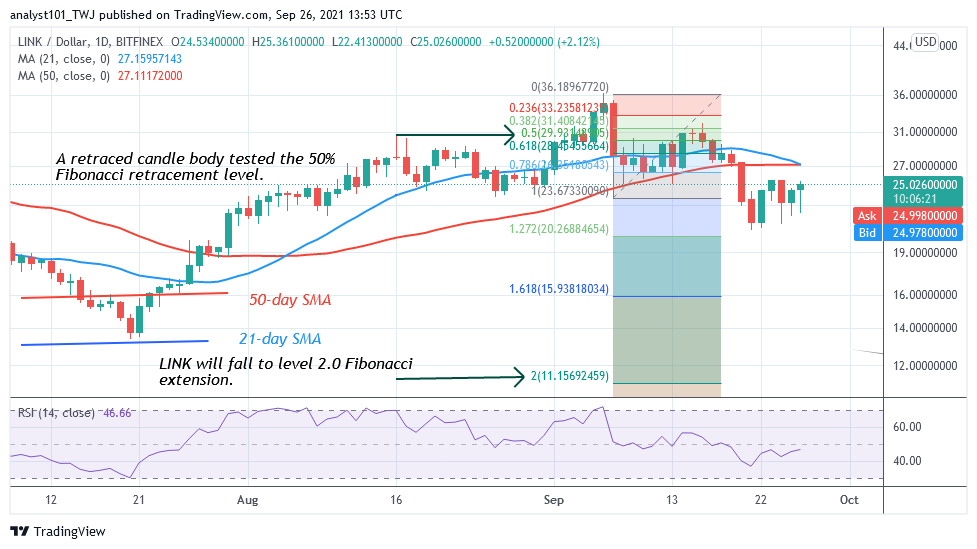
BCH/USD Long-Term Trend — Bullish (Daily Chart)
On the daily chart, BCH has transitioned from a downtrend into a broader range recovery structure. Price action is holding above the mid Bollinger Band, indicating that downside momentum has eased and buyers are defending key support zones. This improvement suggests a shift from pure bearish pressure into a more balanced market context.
What is the market outlook of CMC 20 Index?
#BCH ANALYSIS
After forming higher high and higher lows, BCH is now trying to reclaim the $605 resistance level after being rejected multiple times
Once price reclaim this area, we could see a retest of $649 resistance
A rejection from the $605 level will invalidate the setup pic.twitter.com/d5rOdfNsCr
— Open4profit (@open4profit) December 30, 2025
However, BCH remains beneath significant overhead supply near $613.00, which has repeatedly capped upside attempts. A clean daily close above this level would strengthen the bullish case and open room for expansion toward $650.80 and beyond.
From a broader perspective, BCH/USD is in consolidation within an emerging recovery structure. Momentum indicators are stable rather than oversold or overbought, and the reduced volatility points toward equilibrium rather than trending behavior. This setup often precedes a breakout from range conditions once key levels are contested.

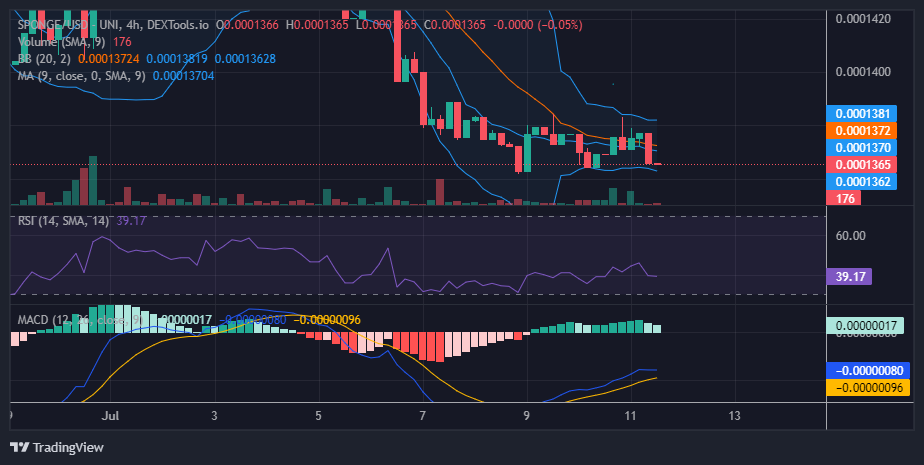
BCH/USD Short-Term — Neutral (4-Hour Chart)
On the 4-hour chart, BCH continues to oscillate around the mid Bollinger Band. Short-term oscillators are not showing strong directional pressure, reinforcing the idea that this is a rotation period rather than a trending environment. The immediate range between $520.10 and $613.00 defines near-term behavior, and a breakout from this band will likely lead to a sharp directional move.
BCH/USD Market Statistics
Current Price: $600.00
Market Capitalization: $11 B
24H Trading Volume: $370 M
Place winning BCH trades with us. Get BCH here