Binance Coin (BNB) Is in a Sideways Trend, Battles the Resistance at $380
Estimated Reading Time: 2 minutes
Don’t invest unless you’re prepared to lose all the money you invest. This is a high-risk investment and you are unlikely to be protected if something goes wrong. Take 2 minutes to learn more

Binance Coin (BNB) Long-Term Analysis: Bearish
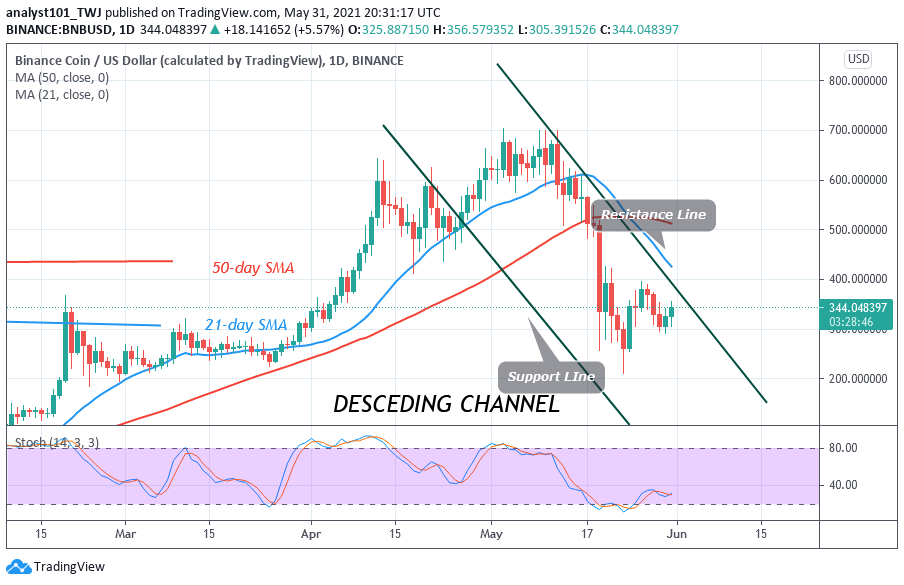
For the past week, Binance Coin has been in an upward move. In the last bearish move, the altcoin slumped to $211 and resumed an upward move. BNB rallied to $375 and resumed a sideways move. The bulls failed to break the recent high which resulted in a sideways trend. On the upside, Binance Coin will rally to $480, if the resistance at $375 is breached.
Binance Coin (BNB) Indicator Analysis
BNB is at level 38 of the Relative Strength Index period 14. It indicates that the altcoin is in the downtrend zone and below the centerline 50. The coin is above the 80% range of the daily stochastic. It indicates that BNB/USD has reached the overbought region. Sellers may emerge in the overbought region. BNB price is below the 21-day and the 50-day SMA which indicates that the coin is in the bearish trend zone and capable of falling on the downside.

Technical indicators:
Major ResistancIs ie Levels – $640, $660, $680
Major Support Levels – $540, $520, $500
What Is the Next Direction for Binance Coin (BNB)?
Binance Coin is in an upward move. The current upward move has been turned into a sideways trend. Meanwhile, on May 25 uptrend; a retraced candle body tested the 61.86% Fibonacci retracement level. The retracement indicates that the market will rise to level 1.618 Fibonacci extension or the high of $473.22.

Note: new.cryptosignals.org is not a financial advisor. Do your research before investing your funds in any financial asset or presented product or event. We are not responsible for your investing results