Binance Coin Is an Uptrend but Stuck Below $510 Resistance
Estimated Reading Time: 2 minutes
Don’t invest unless you’re prepared to lose all the money you invest. This is a high-risk investment and you are unlikely to be protected if something goes wrong. Take 2 minutes to learn more
Binance Coin (BNB) Long-Term Analysis: Bullish
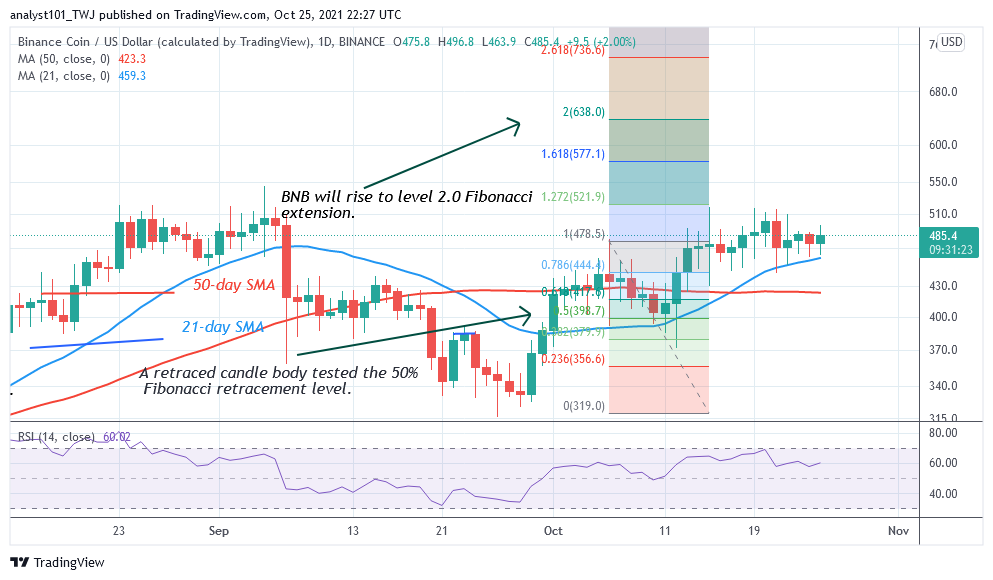
Binance Coin’s (BNB) uptrend is facing rejection at the $510 resistance. Since October 13, the crypto has been fluctuating below the recent high. The altcoin is likely to rise as it finds support above the 21-day SMA. Meanwhile, on October 6 uptrend; a retraced candle body tested the 50% Fibonacci retracement level. The retracement indicates that Binance Coin will rise to level 2.0 Fibonacci extension or $638.0. From the price action, buyers are struggling to break above the $510 resistance.
Binance Coin (BNB) Indicator Analysis
The cryptocurrency is at level 60 of the Relative Strength Index period 14. It indicates that BNB is in the uptrend zone and above the centerline 50. Binance Coin has a bullish crossover. That is, the 21-day SMA crosses above the 50-day SMA which indicates a by signal. BNB is above the 80% range of the daily stochastic. It indicates that BNB is in a bullish momentum and approaching the overbought region.
Technical indicators:
Major Resistance Levels – $640, $660, $680
Major Support Levels – $540, $520, $500
What Is the Next Direction for Binance Coin (BNB)?
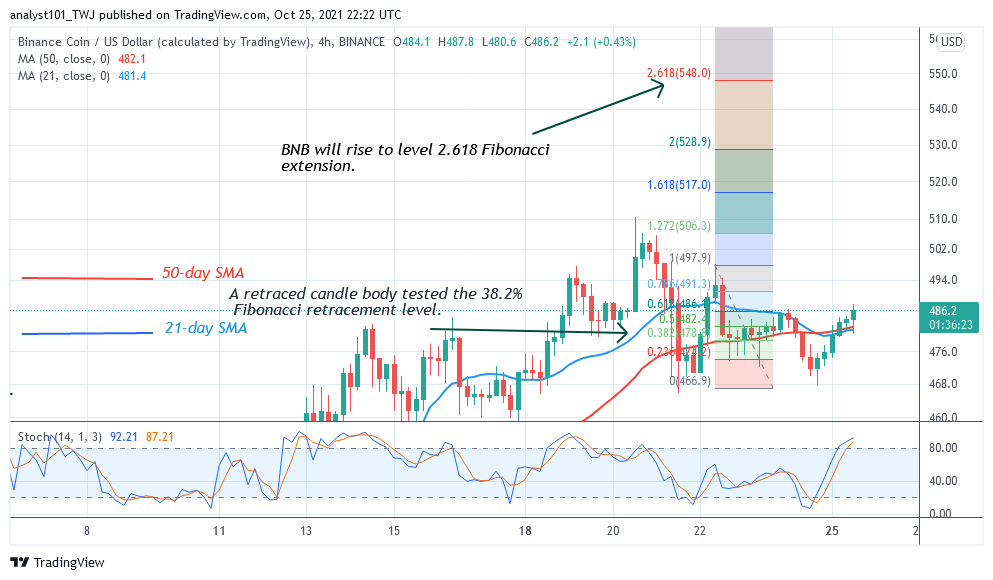
On the 4 –hour chart, BNB/USD is in an upward move. On October 20 price action, the market reached the high of $510 but was resisted. The altcoin fell to $468 low as bulls bought the dips. The bears retested the $468 support twice before resuming upward. Meanwhile, on October 22 uptrend; a retraced candle body tested the 38.2% Fibonacci retracement level. The retracement indicates that Binance Coin will rise to level 2.618 Fibonacci extension or $548.0.
You can purchase crypto coins here. Buy Tokens
Note: Cryptosignals.org is not a financial advisor. Do your research before investing your funds in any financial asset or presented product or event. We are not responsible for your investing results