Binance Coin Is Stuck above $220 Low as It Trades in a Tight Range
Estimated Reading Time: 2 minutes
Don’t invest unless you’re prepared to lose all the money you invest. This is a high-risk investment and you are unlikely to be protected if something goes wrong. Take 2 minutes to learn more
Binance Coin (BNB) Long-Term Analysis: Bearish
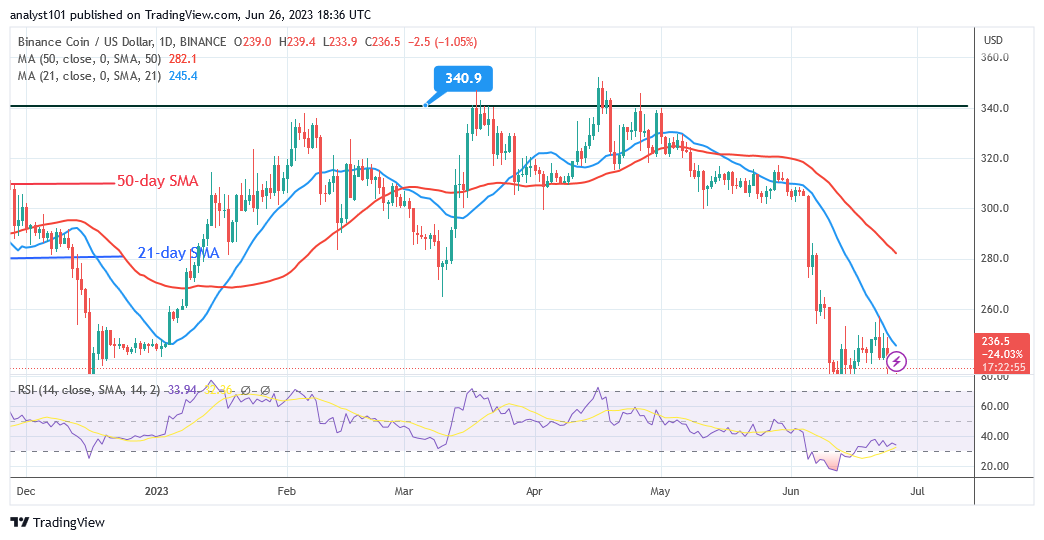
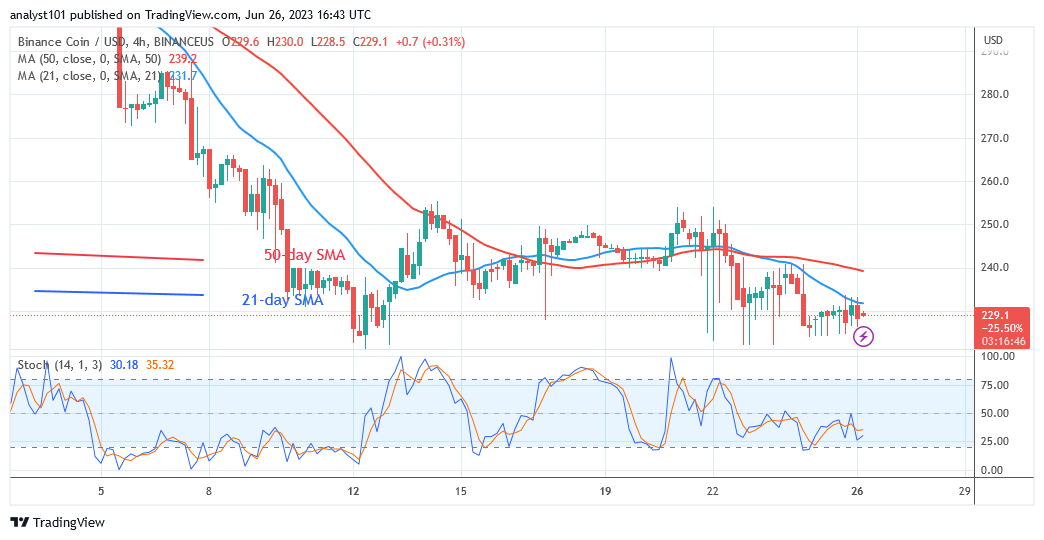
Binance Coin (BNB) has attained bearish exhaustion as it trades in a tight range. On June 12, the crypto asset touched a low of $220 as bulls bought declines. The decline has ended, and the cryptocurrency is now trading in a range between $220 and $260. At the time of writing, BNB is trading at $235.40.
On the upside, the 21-day SMA or resistance at $260 restrains the upward movement. Meanwhile, since December 17, 2022, the existing support has not been breached. Over the last week, BNB has been oscillating above the present support. If the current support holds, the crypto asset will recover.
The market has reached oversold territory, and further decrease is improbable.
Technical indicators:
Major Resistance Levels – $440, $460, $480
Major Support Levels – $240, $220, $200
Binance Coin (BNB) Indicator Analysis
BNB is at level 35 of the Relative Strength Index for period 14. The upward correction has ended, and the altcoin has resumed fluctuating. Although the price bars are below the moving average lines, they are being rejected at the 21-day SMA. This is what has caused the current slump.
The bullish momentum has stalled above the daily Stochastic threshold of 25.
What Is the Next Direction for Binance Coin (BNB)?
Binance Coin has been trading at the bottom of the chart as it trades is in a tight range. The 21-day SMA is restricting the upward movement of the cryptocurrency. BNB is prone to a possible rebound as the altcoin consolidates in a tight range. Meanwhile, the altcoin is trading marginal because of the presence of Doji candlesticks.
You can purchase crypto coins here. Buy LBLOCK
Note: Cryptosignals.org is not a financial advisor. Do your research before investing your funds in any financial asset or presented product or event. We are not responsible for your investing results