Binance Coin Retraces to Breakout Level at $400 amidst Bullish Expectation
Estimated Reading Time: 2 minutes
Don’t invest unless you’re prepared to lose all the money you invest. This is a high-risk investment and you are unlikely to be protected if something goes wrong. Take 2 minutes to learn more

Free Crypto Signals Channel

Binance Coin (BNB) Long-Term Analysis: Bullish
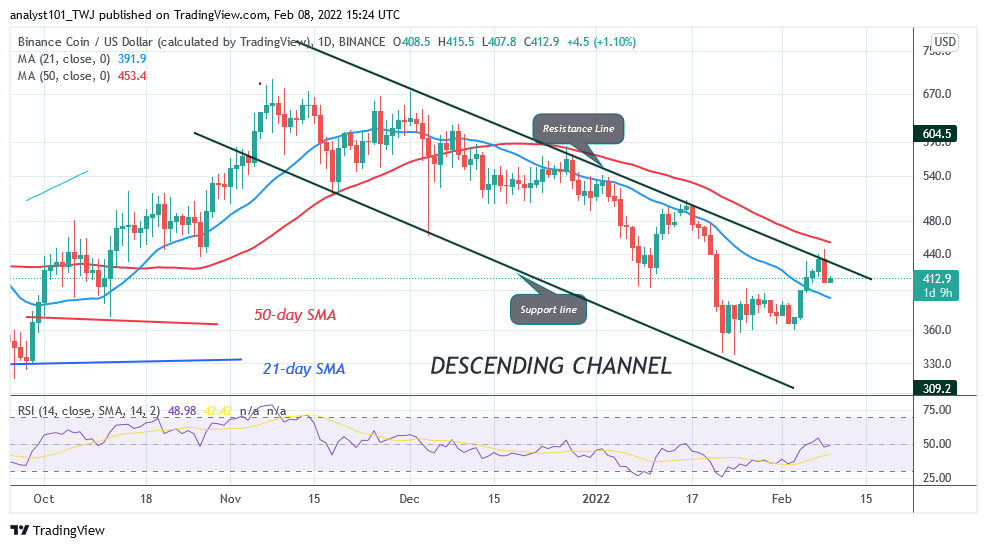
Binance Coin’s (BNB) price has broken the resistance at $400 and the 21-day line moving average amidst bullish expectation. The bulls failed to break the 50-day line moving average. The implication is that BNB prices will be fluctuating between the moving averages. On the upside, if the bulls break above the 50-line moving average, Binance Coin will be out of downward correction. The cryptocurrency will rise to revisit the previous highs of $540 and $670. On the other hand, if BNB turns from the $440 resistance, it may retrace to the breakout level of $400.
Binance Coin (BNB) Indicator Analysis
BNB/USD is at level 48 of the Relative Strength Index period 14. The altcoin is in the downtrend zone despite the recent bullish run. The crypto’s price is above the 21-day SMA but below the 50-day SMA indicating a possible range bound move.BNB is below the 20% range of the daily stochastic. The altcoin has fallen to an oversold region of the market. Buyers are likely to emerge in the oversold region to push prices upward.
Technical indicators:
Major Resistance Levels – $640, $660, $680
Major Support Levels – $540, $520, $500
What Is the Next Direction for Binance Coin (BNB)?
Binance Coin has resumed an upward move as price breaks the resistance at $400 amidst bullish expectation. However, the upward move has been resisted at the $440 high. BNB price retraced to the support at the breakout level of $400.
You can purchase crypto coins here. Buy Tokens
Note: Cryptosignals.org is not a financial advisor. Do your research before investing your funds in any financial asset or presented product or event. We are not responsible for your investing results