Binance Coin Slumps to $409 Low and Resumes Upward Move
Estimated Reading Time: 2 minutes
Don’t invest unless you’re prepared to lose all the money you invest. This is a high-risk investment and you are unlikely to be protected if something goes wrong. Take 2 minutes to learn more
Binance Coin (BNB) Long-Term Analysis: Bullish
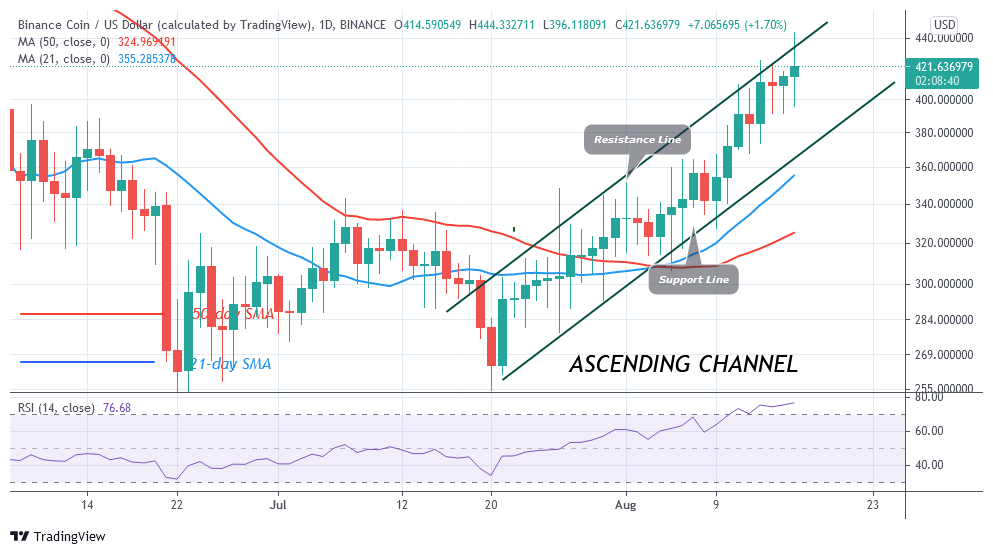
Binance Coin has been in an uptrend. The crypto is in a smooth uptrend as the market rises to the high of $425. On August 16, the crypto rallied in a price spike to a high of $444 but pulled back. Today, the market is retesting a historical price level of June 3. On June 3, the market retested this level and BNB plunged to $224 low and bulls bought the dips, On the upside, if price breaks the present resistance, the market will rally above $440 high. Meanwhile, BNB is in an overbought region, the current bullish momentum is likely to subside. In the meantime, the bulls are struggling to break above the resistance at $425.
Binance Coin (BNB) Indicator Analysis
The crypto is at level 77 of the Relative Strength Index period 14. The altcoin is in the overbought region. Presently, the coin has not room to rally on the upside. Sellers are likely to emerge push prices down.BNB is above the 40% range of the daily stochastic. The crypto is in a bullish momentum. The crypto has a bullish crossover as the 21-day SMA crosses above the 50-day SMA.
Technical indicators:
Major ResistancIs ie Levels – $640, $660, $680
Major Support Levels – $540, $520, $500
What Is the Next Direction for Binance Coin (BNB)?
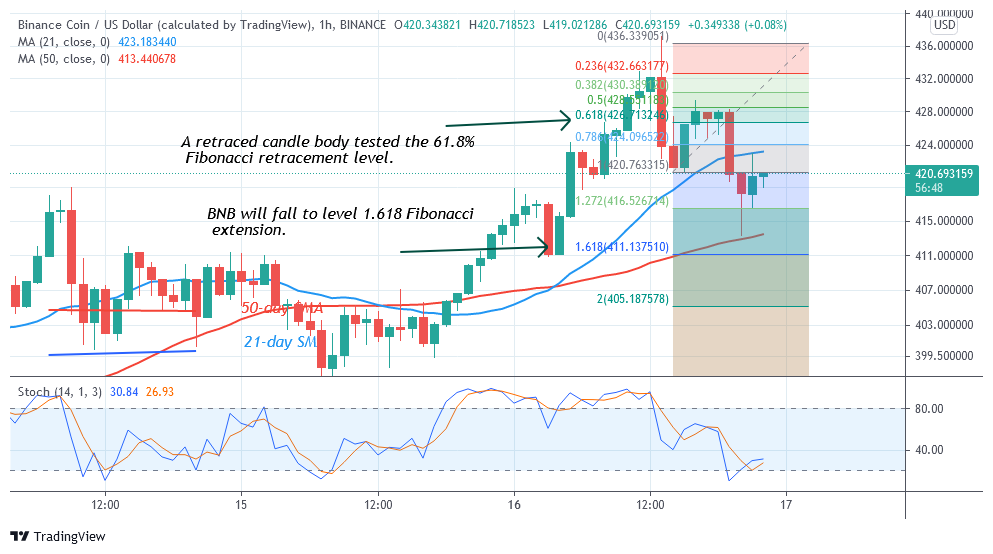
Binance Coin was earlier in a downward move. On August 16 downtrend; a retraced candle body tested the 61.8% Fibonacci retracement level. The retracement indicates that the coin will fall to level 1.618 Fibonacci extension or a level of $411.14. From the price action, the market has retested the 1.618 Fibonacci extension and resumed its upward move.
You can purchase crypto coins here. Buy Tokens
Note: Cryptosignals.org is not a financial advisor. Do your research before investing your funds in any financial asset or presented product or event. We are not responsible for your investing results