BNB Declines as It Revisits Its Previous Low at $580
Don’t invest unless you’re prepared to lose all the money you invest. This is a high-risk investment and you are unlikely to be protected if something goes wrong. Take 2 minutes to learn more

BNB (BNB) Long-Term Analysis: Bearish
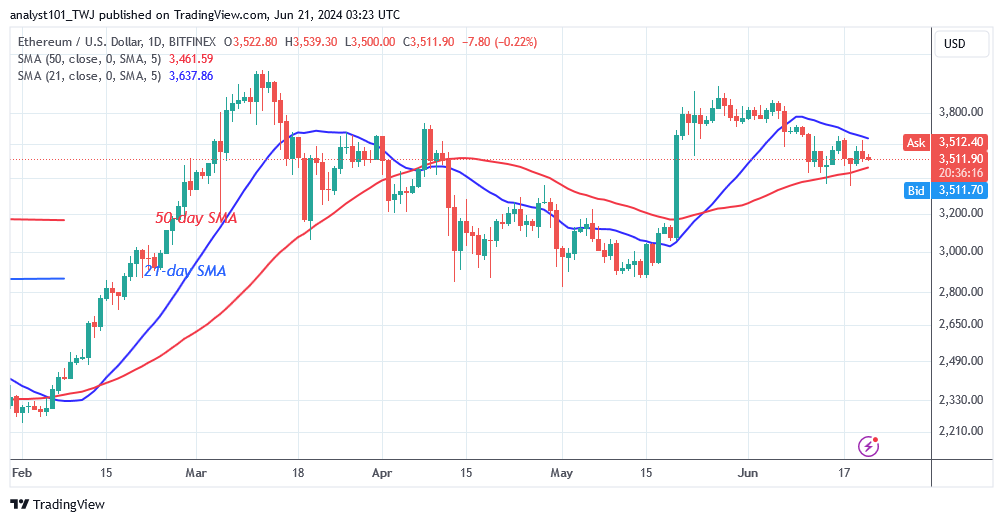
The BNB price has fallen below the moving average as it revisits its previous low at $580. The fall has reached bearish exhaustion. The drop paused above the current support level of $574 on June 18. Following the recent dip, BNB is now trading above the support at $575 but below the 50-day SMA or the resistance at $610. The altcoin is changing modestly within a limited range.
On the negative, if the altcoin loses its current support, it may fall to a low of $560 or $530. Meanwhile, BNB/USD is trading at $583.80 as of this writing.
Technical indicators:
Major Resistance Levels – $600, $660, $720
Major Support Levels – $400, $340, $280
BNB (BNB) Indicator Analysis
The selling pressure has subsided, but the price bars are now lower than the moving average lines. The price of BNB is consolidating above the current $570 support level due to the presence of Doji candlesticks. The moving average lines are sloping horizontally following the decrease below them.
What Is the Next Direction for BNB (BNB)?
BNB has begun a sideways movement as it revisits its previous low at $580. On June 11, the altcoin hit a low of $595 and began a range move. BNB is now trading in the $570-$610 range. The crypto signal is negative as it trades marginally downward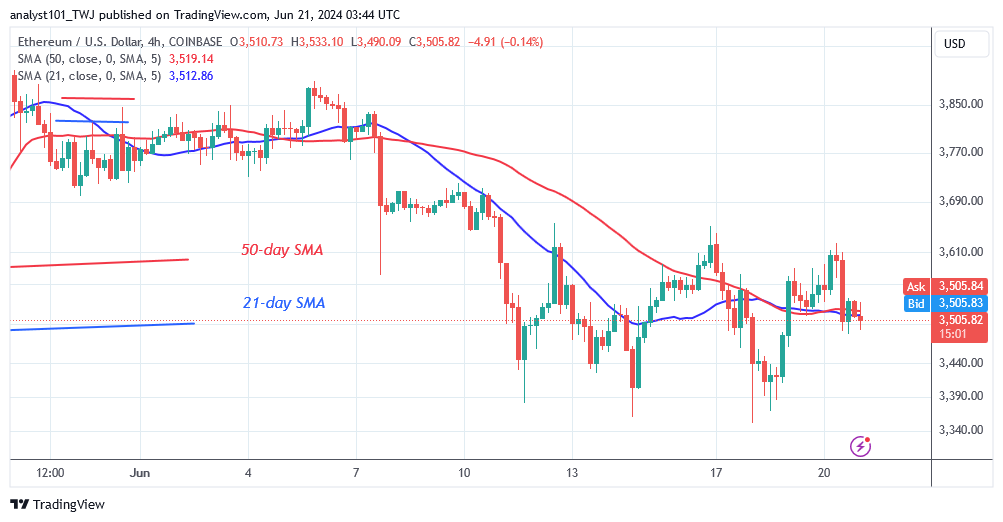
You can purchase Lucky Block here. Buy LBLOCK
Note: Cryptosignals.org is not a financial advisor. Do your research before investing your funds in any financial asset or presented product or event. We are not responsible for your investing results