Bitcoin Cash (BCH/USD) Market Hangs Operations
Estimated Reading Time: 3 minutes
Don’t invest unless you’re prepared to lose all the money you invest. This is a high-risk investment and you are unlikely to be protected if something goes wrong. Take 2 minutes to learn more
Bitcoin Cash Price Prediction – September 17
It now appears that the BCH/USD market hangs operations closely above $600 concurrently over a week and some few days back. The crypto trade keeps a smaller-negative percentage rate of about 0.09 as price valuation is around $638.
BCH/USD Market
Key Levels:
Resistance levels: $800, $1,000, $1,200
Support levels: $500, $400, $300
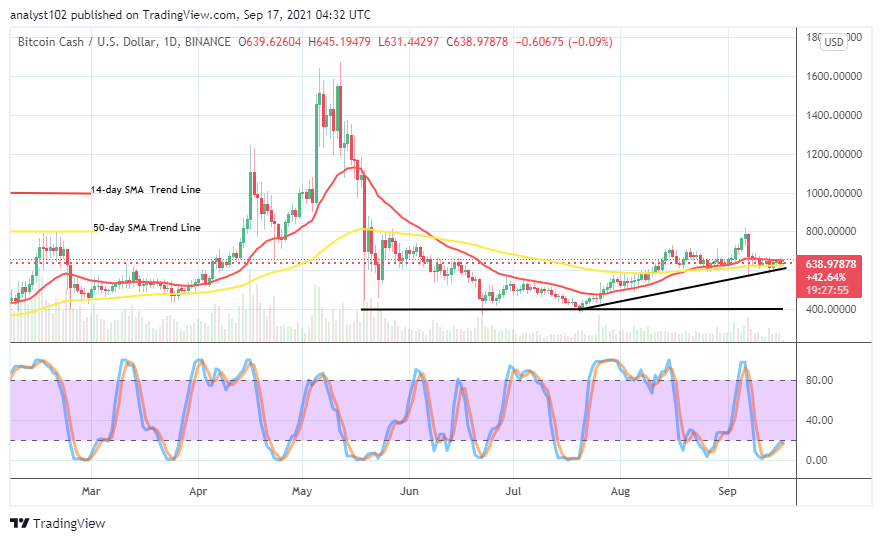
BCH/USD – Daily Chart
There has been a continual slow-moving manner in the crypto-economic trading situation, running into two weeks since the last September 7th sharp drawdown occurrence. The BC/USD daily chart reveals that the market hangs operations closely above the $600 level, noticeable from September 8th until the present. There is a tight closure space between the SMAs as the 14-day SMA indicator is over the 50-day SMA indicator. The bullish trend line drew to mark the actual supportive point beneath the SMAs. The Stochastic Oscillators have crossed the lines northbound in the oversold, nearing the range of 20.
As the BCH/USD market hangs operations closely above $600, will it be prolonged further?
As the BCH/USD market hangs operations closely above $600, the $800 immediate resistance level appears to be the upper range line to the present trading condition of the market. In that case, bulls will have to continue to find a way of building a stance around the lesser value-line mentioned earlier or around the immediate support level of $500.
On the downside, an interception of the bigger SMA trend line by the smaller SMA trend line to the downside will signal a possible return of downward movement that can lead the market to retest its previous low of $400. However, even if that sentiment plays out, it will be another cycle of investing opportunity that investors shall have to take advantage of.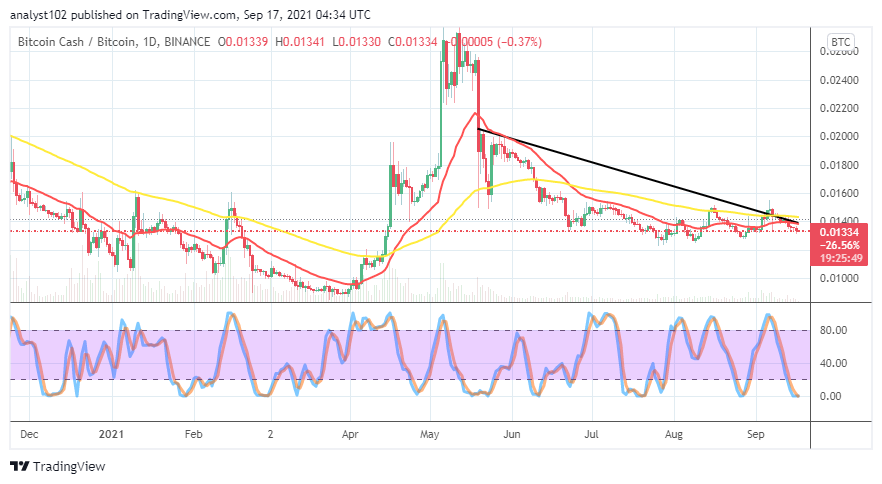
BCH/BTC Price Analysis
In comparison, the BCH/BTC price analysis chart shows that the cryptocurrency pair market hangs operations beneath its trading indicators. In other words, it means that the base crypto is still somewhat under pressure by the trending capability of its counter crypto. The 50-day SMA indicator is near above the 14-day SMA indicator. The Stochastic Oscillators have dipped down into the oversold region to touch the critical zero range line. That suggests that the BCH may soon be pushing its position against BTC in the near time.
Note: Cryptosignals.org is not a financial advisor. Do your research before investing your funds in any financial asset or presented product or event. We are not responsible for your investing results.
You can purchase crypto coins here. Buy Tokens