SPONGE/USD ($SPONGE) Briefly Breaks Above $0.000120 Before Pulling Back to Key Support
Estimated Reading Time: 3 minutes
Don’t invest unless you’re prepared to lose all the money you invest. This is a high-risk investment and you are unlikely to be protected if something goes wrong. Take 2 minutes to learn more

The SPONGE/USD market has shown notable volatility since yesterday, marked by a series of sharp price movements. Initially, the pair rallied to the $0.000105 resistance zone, but faced rejection at that level. As anticipated in previous analysis, bulls regrouped around the critical $0.0001 support level and initiated another upward push.
This renewed buying momentum propelled the price above the $0.000120 mark—highlighting strong short-term bullish sentiment. However, the rally was short-lived, as profit-taking at higher levels triggered a swift retracement, sending the price back to the $0.0001 support area.
This pattern underscores the importance of $0.0001 as a pivotal zone for bullish defenses and potential reentry, while also identifying $0.000120 as a near-term resistance level where sellers tend to emerge.
Key Levels to Watch
- Resistance: $0.000110, $0.000120, $0.000130
- Support: $0.000090, $0.000085, $0.000080
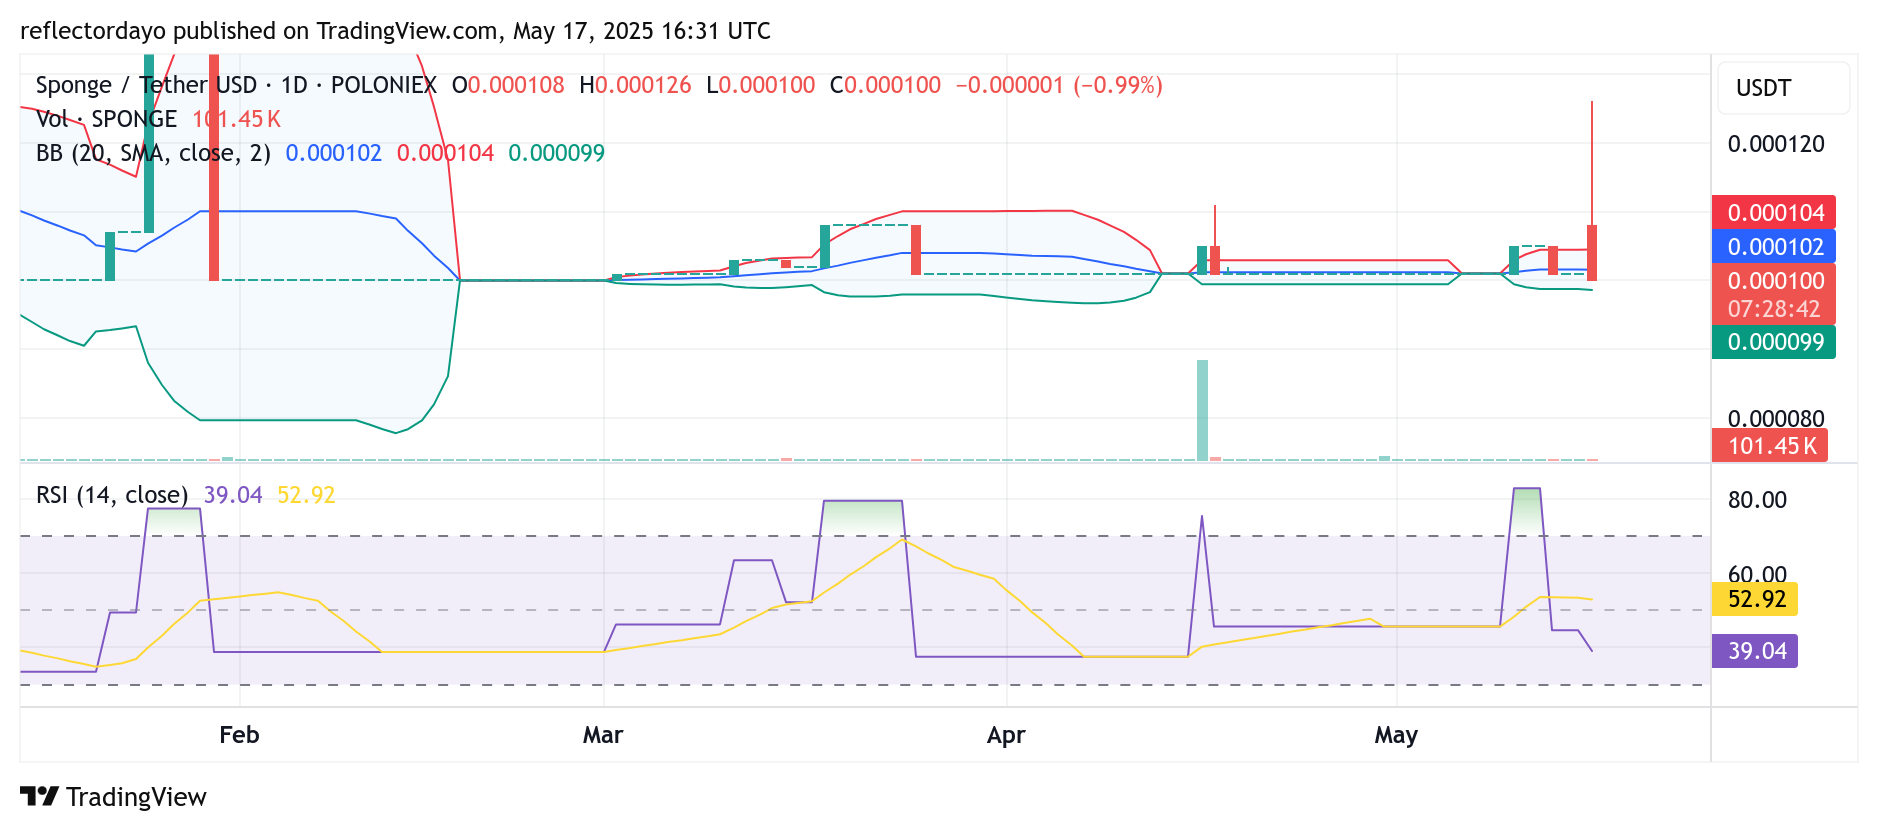
SPONGE/USD Daily Chart: Bulls Defend $0.0001 Support as Volatility Peaks
Recent market volatility has given bears the upper hand, driving SPONGE/USD sharply back down to the critical $0.0001 support level. Despite the pullback, bullish traders appear to be reassessing their positions and preparing to re-enter the market at this key price zone.
Currently, bulls are making a concerted effort to defend the $0.0001 level, aiming to prevent further downside. Historical price action suggests this level has consistently acted as a strong support, and with bearish momentum showing signs of exhaustion, a sustained breakdown below this threshold appears unlikely in the short term.
Traders may view this zone as a potential reentry point, especially as the market begins to show signs of recovery. With bullish momentum likely to return, conditions appear increasingly favorable for another upward move.
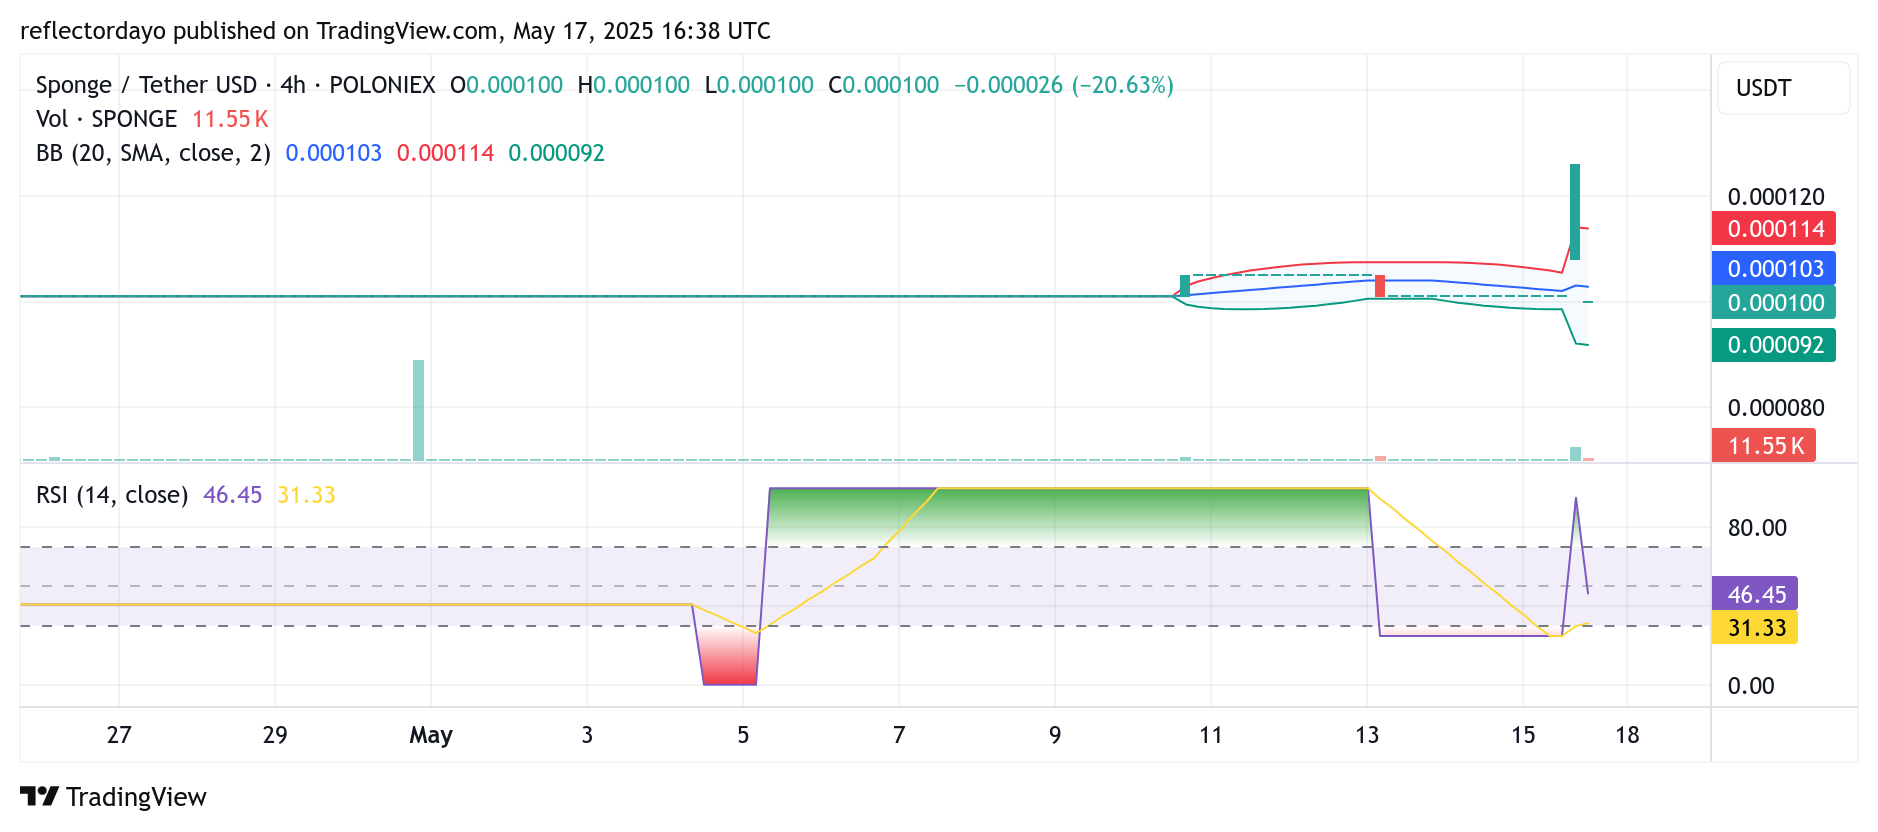
SPONGE/USD 4-Hour Chart: Market Pauses at Key Support as Bulls Prepare for Potential Rebound
A closer examination of the SPONGE/USD 4-hour chart reveals the recent bullish surge that propelled the price above the $0.00012 level. This upward movement was marked by a strong marubozu candlestick, indicating clear dominance by the bulls during that trading session.
However, selling pressure intensified around the $0.000126 level, where bears seized control and pushed the price downward, capitalizing on heightened market volatility. Since then, momentum has slowed, and the market has entered a consolidation phase.
Currently, a four-price doji candlestick at the $0.0001 support level signals a moment of indecision, with demand and supply in perfect balance. This suggests that bearish momentum may be weakening and that the downward move could be reaching exhaustion.
If history is any guide, this equilibrium at a major support level often precedes a bullish reversal. As such, this may present a strategic buying opportunity for traders anticipating the next upward leg.
Buy $SPONGE!
Don’t be the guy who faded pic.twitter.com/tC1QJmLOkj
— $SPONGE (@spongeoneth) May 2, 2025
Join the SPONGE community and get in on the next big crypto opportunity! Buy Sponge ($SPONGE) today