Bitcoin Cash (BCH/USD) Price Remains in Descending Order
Estimated Reading Time: 3 minutes
Don’t invest unless you’re prepared to lose all the money you invest. This is a high-risk investment and you are unlikely to be protected if something goes wrong. Take 2 minutes to learn more

Free Crypto Signals Channel
Bitcoin Cash Price Prediction – March 11
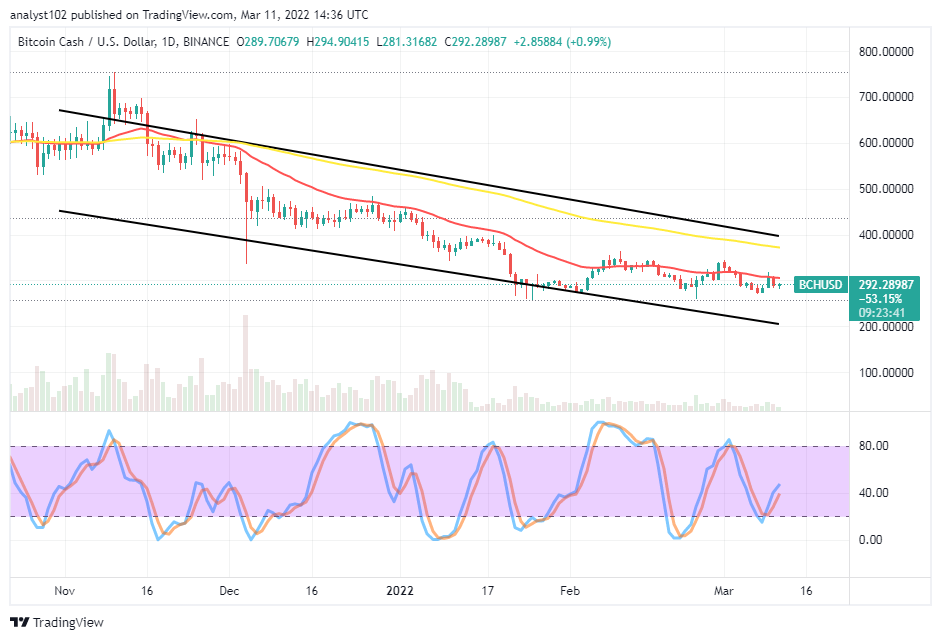
There has been no significant change of direction in the method the BCH/USD market activities have been trending as the crypto-economic price remains in descending order. Presently, the market possesses a minute positive percentage of 0.99 as it trades between $294 and $281 value-lines.
BCH/USD Market
Key Levels:
Resistance levels: $350, $400, $450
Support levels: $250, $200, $150
BCH/USD – Daily Chart
The BCH/USD daily chart shows the crypto-economic price remains in descending order as the trading indicators point to the south side. The 50-day SMA trend line is above the 14-day SMA trend line as the bearish channels drew to enclose them within. The Stochastic Oscillators are down within the range-lines of 40 and 20. And they are now attempting to cross northbound against the higher range-line to denote that a buying force is relatively ongoing.
Can there be continual upkeep of the current trading pattern in the BCH/USD market as the crypto’s price remains in descending order?
There can be continual upkeep of the current trading pattern in the BCH/USD market as the crypto-economic price remains in descending order. The falling process underneath the trend line of the smaller SMA that should turn out yielding a conducive outcome for finding support for an upward returning upspring hasn’t been that positive afterward. It seems that the price has to push sharply toward lower support around $200 to gain a better stance for a rebound.
On the downside of the technical analysis, the smaller SMA indicator will serve as the yardstick to determine timely interference of the selling order as long as the far price doesn’t make an upward to shoot far away sustainably from $300. If the crypto economy pushes northward forcefully against a higher resistance around $400, that will be signal that the price is reshaping toward achieving trading a higher resistance spot.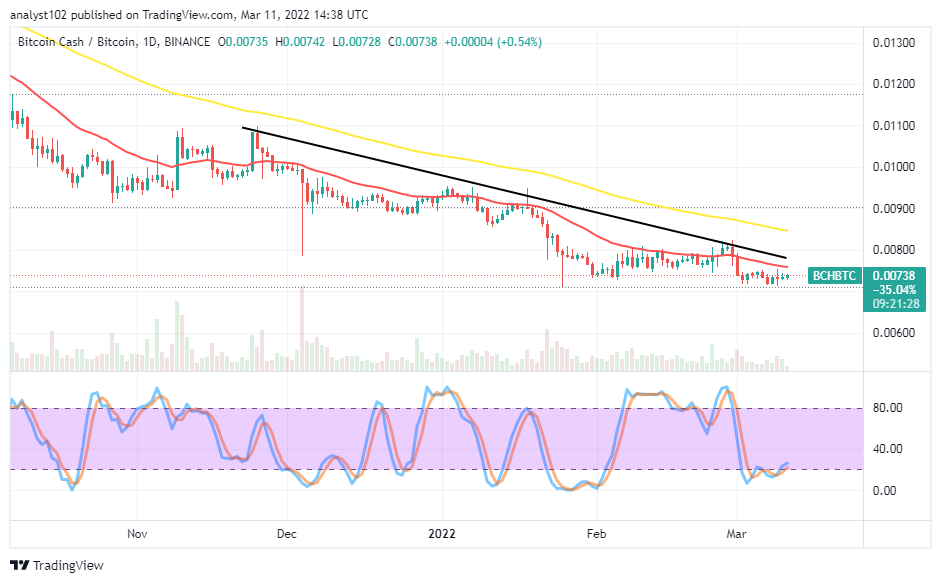
BCH/BTC Price Analysis
In comparison, Bitcoin Cash’s trending outlook stays under a falling setting juxtaposed with Bitcoin on the daily price analysis chart. The cryptocurrency pair market price remains in descending order underneath the trend line of the bigger SMA. The 14-day SMA indicator is underneath the 50-day SMA indicator. The bearish trend line is drawn between the SMAs closer to the smaller SMA to show the points of resistant operations to the downside. The Stochastic Oscillators are moving in a consolidation style around the range of 20 near in the oversold region. And the situation has been backed up by featuring variant smaller candlesticks to denote that a range-line of price actions is ongoing.
Note: Cryptosignals.org is not a financial advisor. Do your research before investing your funds in any financial asset or presented product or event. We are not responsible for your investing results.
You can purchase Lucky Block here. Buy LBlock: