Bitcoin (BTC) Price Prediction: BTC/USDT Rebounds Upward After Dipping Below the $60,000 Mark
Estimated Reading Time: 3 minutes
Don’t invest unless you’re prepared to lose all the money you invest. This is a high-risk investment and you are unlikely to be protected if something goes wrong. Take 2 minutes to learn more
Bitcoin (BTC) Price Prediction: June 26
The BTC/USDT market has been fluctuating within a moderately wide price range of $71,868 and $60,000 since March this year (2024). For the most part, the market has been moving back and forth, occasionally dipping below the technical support at the $60,000 price level.
BTC/USDT Long-term Trend: Bullish (Daily Chart)
Key Price Levels:
Resistance Levels: $65,000, $70,000, and $75,000
Support Levels: $60,000, $55,000, and $50,000
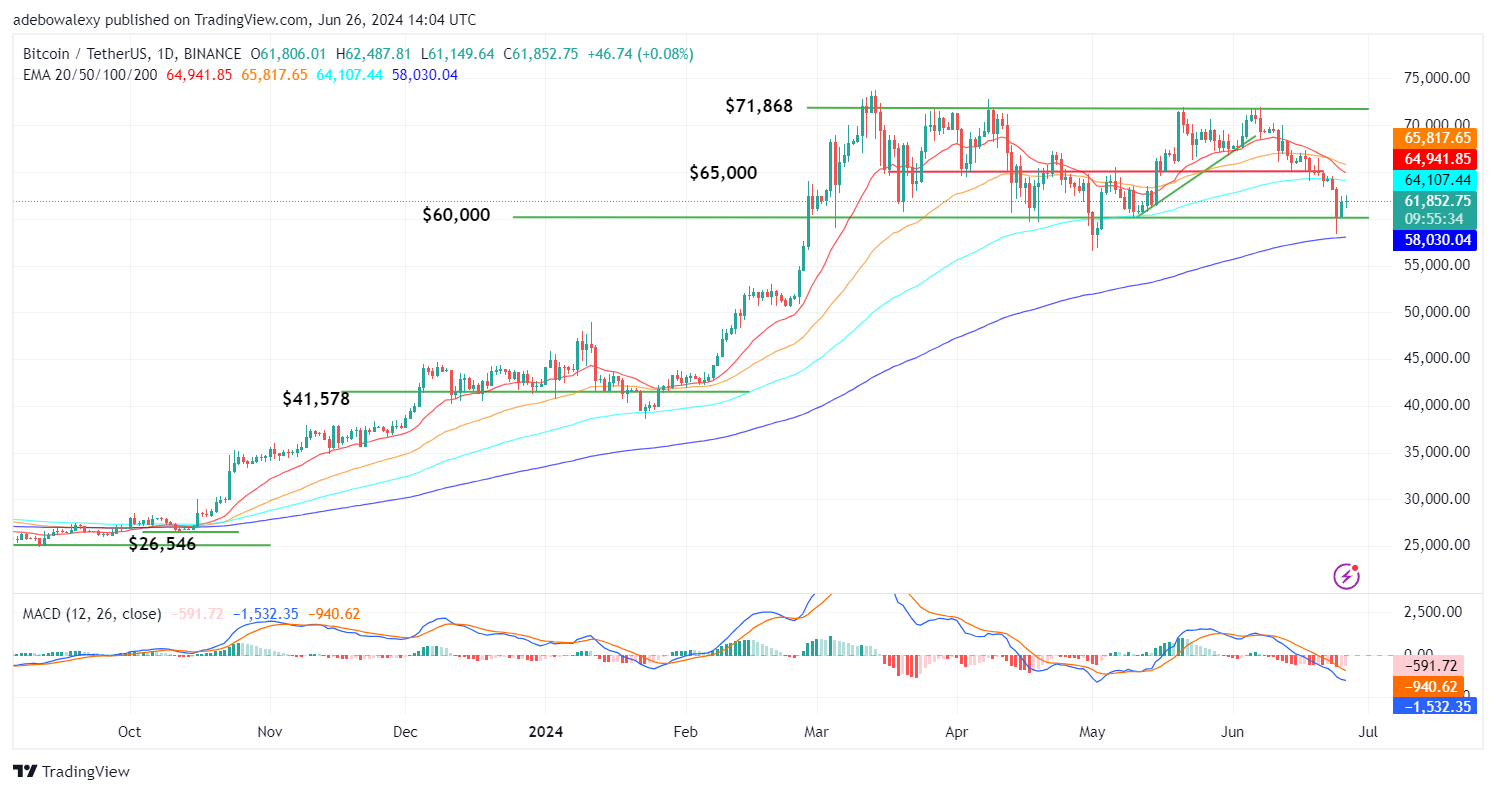
The previous session saw the market take off from the support mentioned above, but the market has tried to maintain the move against a strong headwind at the moment. Consequently, price activity in the Bitcoin daily market lies below most of the Exponential Moving Average (EMA) lines. Also, the last price candle here can be seen appearing as a doji above the 100-day EMA curve. Meanwhile, the Moving Average Convergence Divergence (MACD) lines are below the equilibrium level, with the indicator bars now pale red in appearance.
Bitcoin Price Prediction: BTC/USDT Market Forces Battling Near the $62,000 Threshold
The previous session saw Bitcoin record a moderate upside correction. However, the following session after that seems to have quickly come under the attack of headwinds. This can be seen through the appearance of the last green price candle on this chart. Price forces are already engaged in a tug-of-war above the 100-day EMA lines.
Meanwhile, the MACD lines are already below the equilibrium level, and despite the previous gains, its bars are still pale red. This suggests that headwinds may still have the upper hand in the battle for control. Consequently, this may restrain the market’s movement around the $62,000 mark for a while.
BTC/USDT Medium-term Trend: Bitcoin Price Action Still Struggles to Find Strong Support (4H Chart)
Price action in the BTC/USDT 4-hour market can be seen attempting to find a sure footing above notable indicator landmarks. Here, the market had previously recoiled off the 20-day EMA line as a resistance. Meanwhile, the current session has seen a moderate recovery as the market seems headed towards the 20-day EMA curve. Simultaneously, the MACD lines can be seen slowly taking on an upward trajectory, with its last bar now solid green.
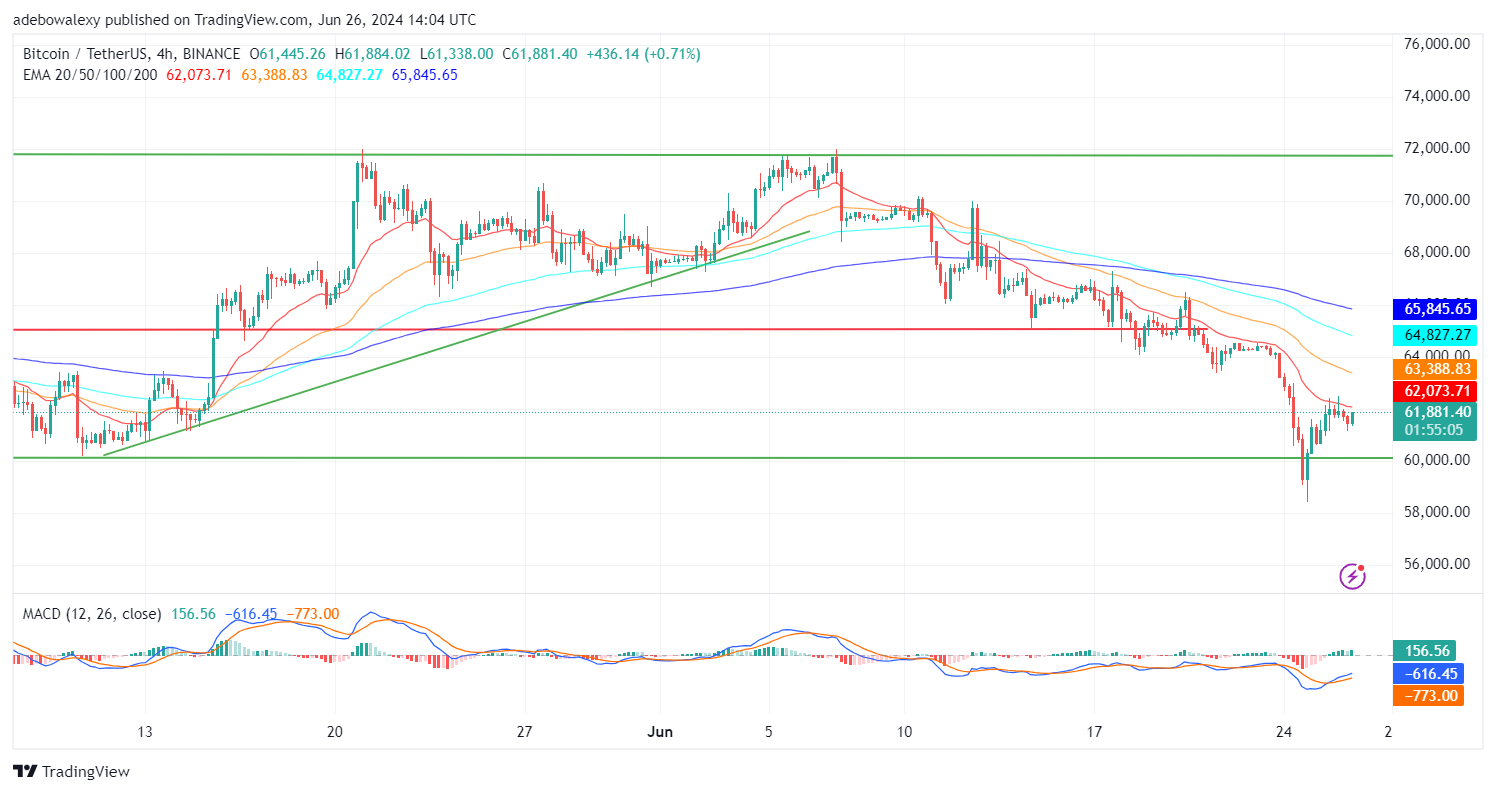
Going by the current advances, the market seems quite subdued but has promise. This stems from the fact that price action has a bullish trajectory, no matter how small it may be at the moment. Also, the last bar of the MACD is currently solid green, which indicates that bullish momentum is building up and may propel the market through the $62,000 mark towards the $65,000 price level later.