Bitcoin (BTC/USD) Market Continually Keeps Bullish Channels
Estimated Reading Time: 3 minutes
Don’t invest unless you’re prepared to lose all the money you invest. This is a high-risk investment and you are unlikely to be protected if something goes wrong. Take 2 minutes to learn more
Bitcoin Price Prediction – August 25
The BTC/USD market continually keeps the bullish channels as it shows a sign of price corrections. The crypto’s percentage rate is at about -0.38 to trade around the level of $48,653 as of writing.
BTC/USD Market
Key Levels:
Resistance levels: $50,000, $52,500, $55,000
Support levels: $47,500, $45,000, $42,500
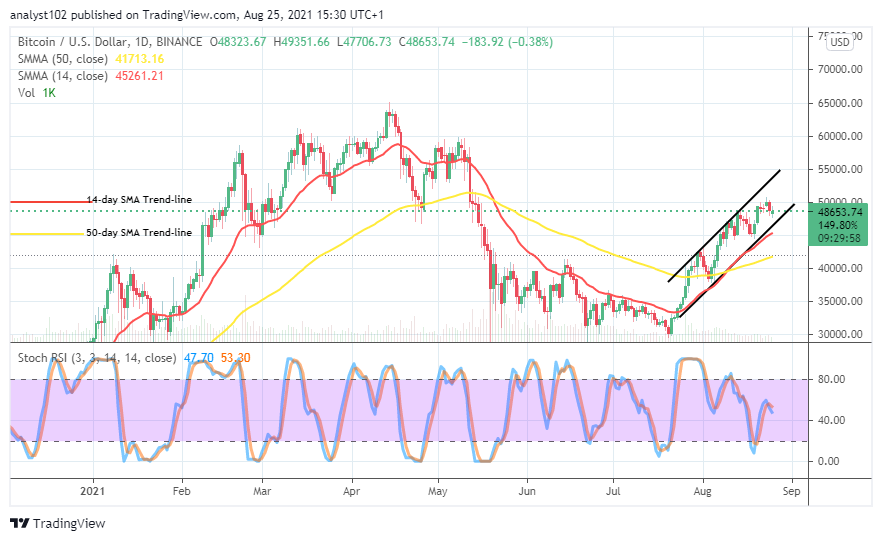
BTC/USD – Daily Chart
The BTC/USD daily chart showcases that the crypto market continually keeps the bullish channels. And, a chain of Japanese trading candlesticks exhibits a line of price retraces on a lighter note. The lower bullish trend-line tightly drew alongside the 14-day SMA trend-line above the 50-day SMA trend-line. All the SMA trading indicators point toward the north side. The Stochastic Oscillators have slightly closed the lines between the ranges of 40 and 80. It seems that the market may not move actively pending a time.
Could the BTC/USD price drop further as the market continually keeps within the bullish channel trend lines so far?
There has been no significant signal to warrant a reliable downward motion in the BTC/USD trade operation as the market keeps within the bullish channels drawn so far. The current price retracement movement hasn’t gained the catalyst to nudge the market into a full-fledged bearish trend. Instead, bulls are to use price retracement motion to fish out for a decent buy entry.
On the downside, the BTC/USD market bears must allow a line of pull-ups to another formation at a higher trading zone where series of price rejections has a higher potency of resurfacing before a sell order can exert. Price needed to allow trade near the upper bullish channel trend-line to encounter resistance before a sell set up may again play out in the market. 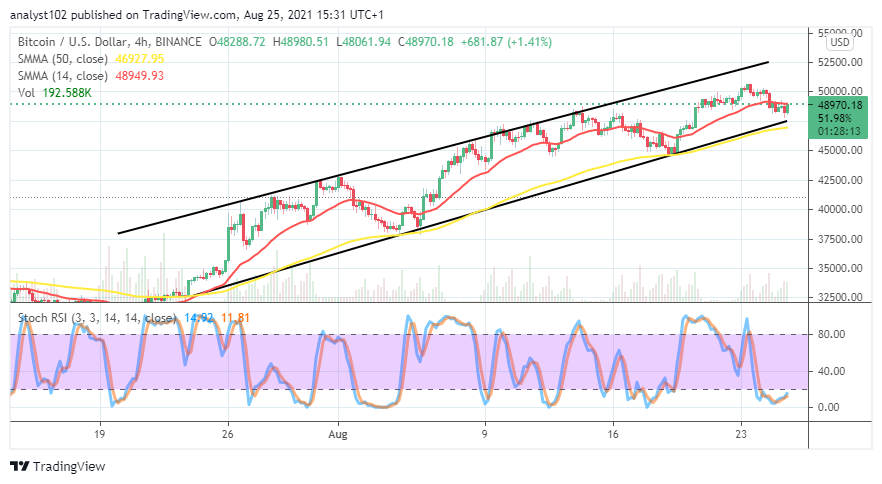
BTC/USD 4-hour Chart
The BTC/USD 4-hour chart shows a perfect up-keep of the northward motions as the crypto market continually keeps bullish channels. The 14-day SMA indicator is over the 50-day SMA indicator as the bullish trend-line remains drawn alongside the bigger SMA. The Stochastic Oscillators are in the oversold region with conjoined lines, consolidating in it. It signifies an expectation that the base trading instrument may soon regain momentum to push against the US counter fiat currency.
Note: Cryptosignals.org is not a financial advisor. Do your research before investing your funds in any financial asset or presented product or event. We are not responsible for your investing results.
You can purchase crypto coins here. Buy Tokens