Bitcoin (BTC/USD) Market Intensifies Featuring at $60,000
Estimated Reading Time: 3 minutes
Don’t invest unless you’re prepared to lose all the money you invest. This is a high-risk investment and you are unlikely to be protected if something goes wrong. Take 2 minutes to learn more
Bitcoin Price Prediction – October 24
There have been signs that the BTC/USD market intensifies featuring, around the $60,000 in a continued retracement process. The crypto’s price trades around $60,649 at a negative percentage rate of 1.39.
BTC/USD Market
Key Levels:
Resistance levels: $62,500, $65,000, $67,500
Support levels: $57,500, $55,000, $52,500
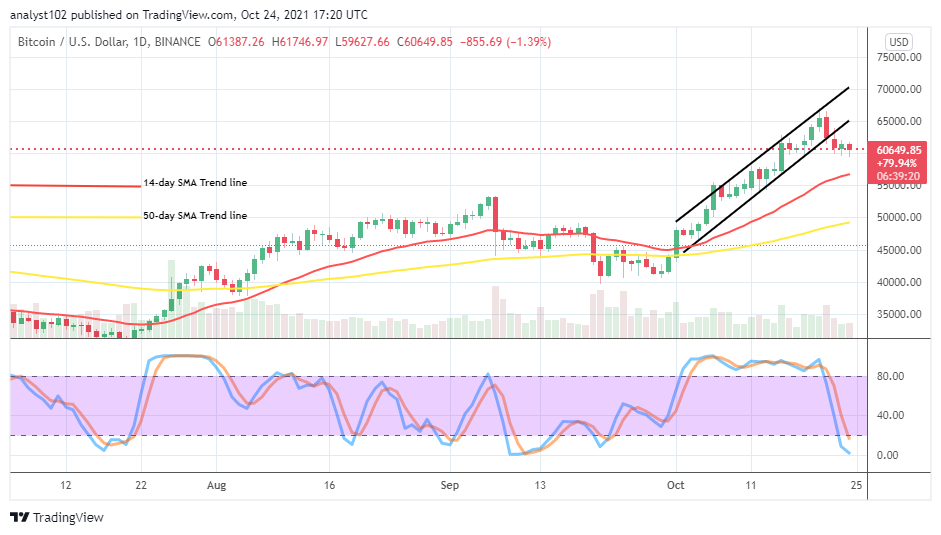
BTC/USD – Daily Chart
It revealed on the BTC/USD daily chart that the market intensifies featuring at $60,000 level. A chain of about smaller three bottom shadow candlesticks has emerged around the point to attest to the present trading outlook. The 14-day SMA trend line is over the 50-day SMA indicator. The Stochastic Oscillators have freshly moved into the oversold region, trying to touch the zero range line. That signifies that the market may soon rebuild its momentum at a lower spot.
Will there be a deepening of price retracement in the BTC/USD operations as the market intensifies featuring at $60,000?
It may take a while the BTC/USD trade operations swing up and down around the $60,000 level as the market intensifies featuring around the value line. While the price retracement motion gets further heightening, support levels around $57,500 or $55,000 will be the main focus where the market tends to settle for mustering energy. Therefore, buyers would have to keep those points on their trading notes.
On the downside of technical analysis, a higher point away from $60,000 will have to witness an active upward price reversion so that it will be easy to breach at the value line southward. However, the motion could be to allow the sellers to catch out quick profits within a moment. In other words, it is risky to dwell long on a depression carrying a rebounding moving pattern around the smaller SMA indicator to avoid getting whipsawed in no time.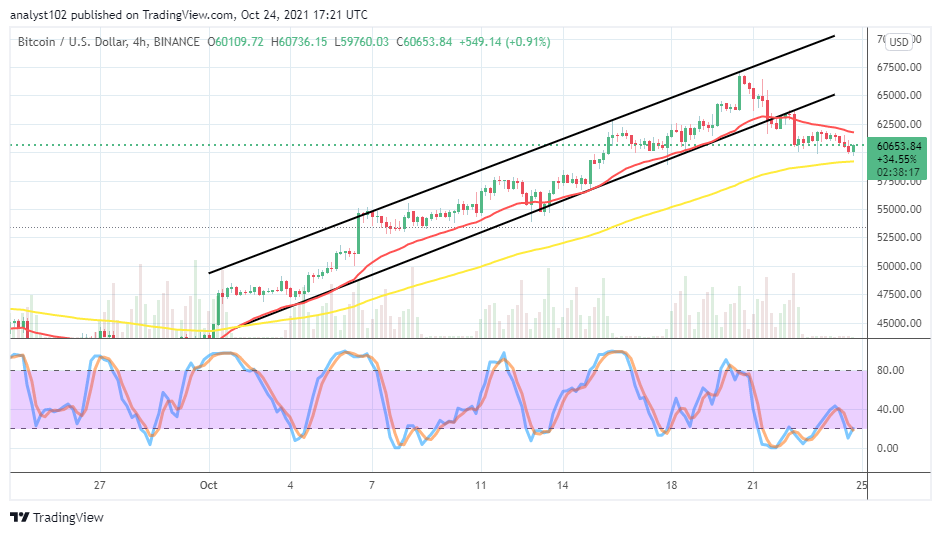
BTC/USD 4-hour Chart
The BCT/USD 4-hour chart reveals that the crypto-economic market intensifies featuring in a retracement moving manner as price pushes closer to the bigger SMA trend line. The 14-day SMA indicator is above the 50-day SMA indicator. The Stochastic Oscillators have been swinging around ranges between 40 and the oversold region. And they now try to close the lines at the range of 20, probably to signify a northbound direction. That means Bitcoin is making an effort to regain its lost relative energy as traded against the valuation of the US Dollar.
Note: Cryptosignals.org is not a financial advisor. Do your research before investing your funds in any financial asset or presented product or event. We are not responsible for your investing results.
You can purchase crypto coins here. Buy Tokens