Bitcoin (BTC/USD) Market Precipitates in Ranges Below $20,000
Estimated Reading Time: 3 minutes
Don’t invest unless you’re prepared to lose all the money you invest. This is a high-risk investment and you are unlikely to be protected if something goes wrong. Take 2 minutes to learn more

Free Crypto Signals Channel
Bitcoin Price Prediction – September 28
The trade happenings between the buyers and the sellers in the BTC/USD business activities exhibit that the crypto market precipitates in ranges below the logical $20,000 line. In the last several hours of today running, price has traded between the high and low value lines of $19,253.15 and $18,480.12.
BTC/USD Market
Key Levels:
Resistance levels: $22,500, $25,500, $27,500
Support levels: $17,500, $15,000, $12,500
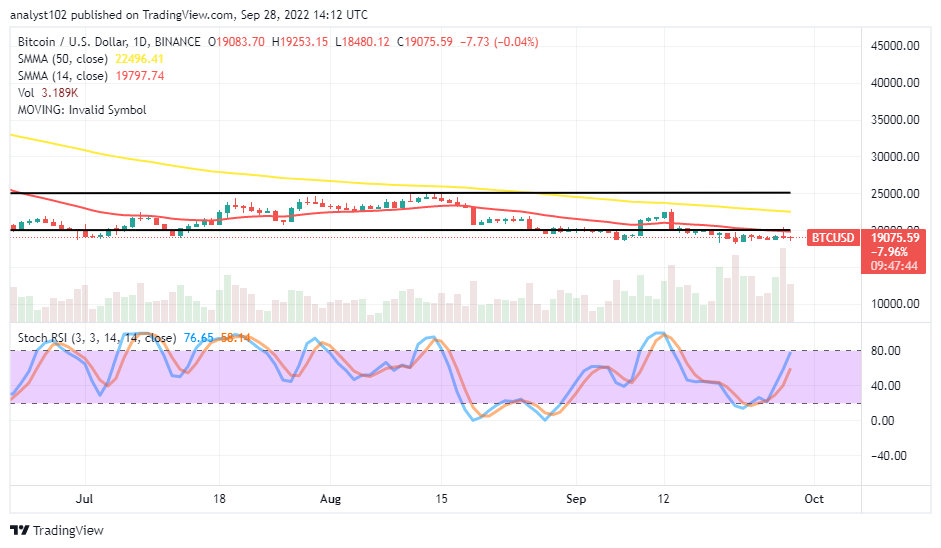
BTC/USD – Daily Chart
The BTC/USD daily chart showcases the crypto-economic market precipitates in ranges below the $20,000 level. The 14-day SMA indicator has briefly trended past the horizontal line drawn at the value line to the tune of $19,797.74, underneath the $22,496.41 point of the 50-day SMA indicator. The upper horizontal range line remains drawn at the $25,000 resistance level. The Stochastic Oscillators have crossed northbound from the range of 20 to the range values of 58.14 and 76.65.
Can there be more ups in the BTC/USD trade operation to stay above the $20,000 logical point?
There is the possibility that the BTC/USD trade push for ups to stay above the $20,000 logical point in the run to average the resistance value given by the reading of the 50-day SMA. A breakout of the value line will allow the market to surge to around the $25,000 resistance trading level. Long-position placers need to be cautious of any active reversal in the process of attempting to push northward.
On the downside of the technical analysis, selling activities may tend to locate an ideal environment to thrive over the usual in-active pushing approach that the BTC/USD market bulls have been putting on closely below the 50-day SMA trend line. The Stochastic Oscillators’ readings in the overbought region to give a southbound-pointing posture will serve as a better sign to achieve a decent selling order entry afterward.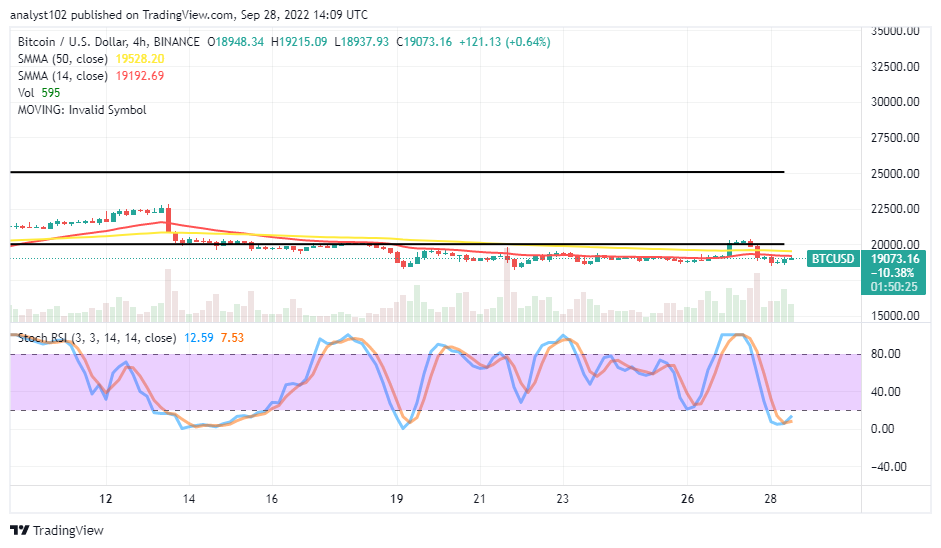
BTC/USD 4-hour Chart
The BTC/USD medium-term chart displays the crypto-economic market precipitates in ranges below the $20,000 psychological trading level. Some failed efforts have been around the value line. The 14-day SMA indicator is at $19,192.69, underneath the $19,528.20 value of the 50-day SMA indicator. The Stochastic Oscillators are dipped into the oversold region, seemingly trying to cross northbound as they are around 7.53 and 12.59 range points. The last three 4-hour candlesticks possess promissory upswings close to the sell signal side of the smaller SMA. A low-active rallying motion may still occur subsequently.
Note: Cryptosignals.org is not a financial advisor. Do your research before investing your funds in any financial asset or presented product or event. We are not responsible for your investing results.
You can purchase Lucky Block here. Buy LBLOCK