KAITO (KAITO/USD) Market Shows Bullish Momentum
Estimated Reading Time: 3 minutes
Don’t invest unless you’re prepared to lose all the money you invest. This is a high-risk investment and you are unlikely to be protected if something goes wrong. Take 2 minutes to learn more

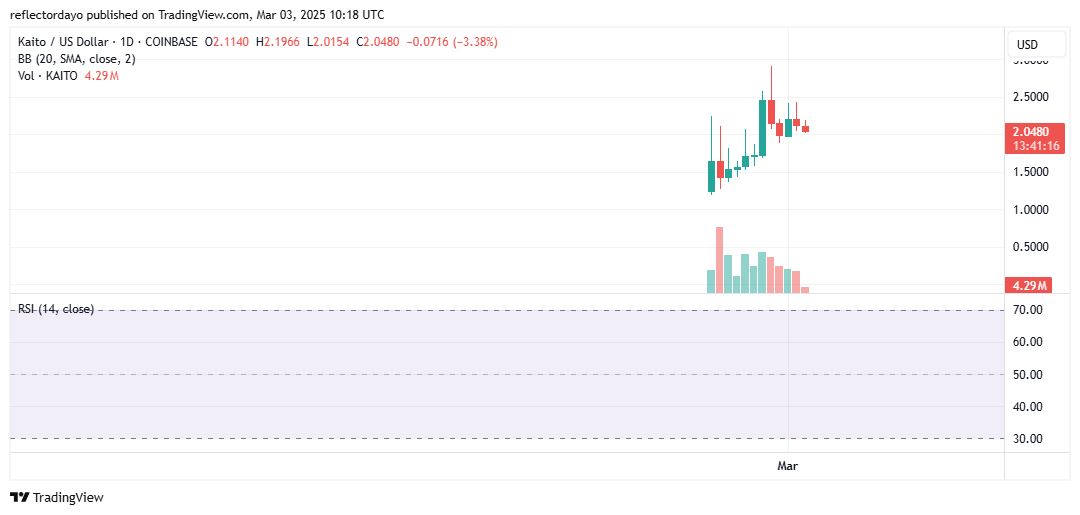
The Kaito market is gaining bullish momentum despite being a newly launched asset with limited historical data on the daily chart. However, its performance so far has been impressive, favoring optimistic speculators. Currently, the market has established a higher support level at $2.00, while its launch price appears to have been around $1.19. At present, the market is encountering resistance at $2.50.
KAITO serves as the native token of the Kaito ecosystem, an AI-powered information finance (InfoFi) network designed to enhance the flow of information, attention, and capital within the cryptocurrency industry.
The Kaito Market Data
- KAITO/USD Price Now: $2.06
- KAITO/USD Market Cap: $494.87 million
- KAITO/USD Circulating Supply: 241.4 million KAITO
- KAITO/USD Total Supply: $1 billion KAITO
- KAITO/USD CoinMarketCap Ranking: #118
Key Levels
- Resistance: $2.50, $3.00, and $3.50
- Support: $1.50, $1.00, and $0.90.
The Kaito Market Through the Lens of Indicators
As a new entrant in the cryptocurrency market, KAITO has experienced significant volatility since its debut. The market appears to have launched on February 20, aligning with the first recorded candlestick on the daily chart. Given its recent introduction, KAITO has been highly volatile as it seeks to establish a stable price level.
So far, the market has secured a higher support level at $2.00, with bullish momentum driving volatility to the upside. A resistance level has emerged at $2.50, signaling a key crypto price barrier.
While the Bollinger Bands and Relative Strength Index (RSI) indicators currently lack sufficient historical data to generate reliable signals, the trading volume indicator shows a decline in histogram heights. This suggests that price movement may be stabilizing around the $2.00 support level.
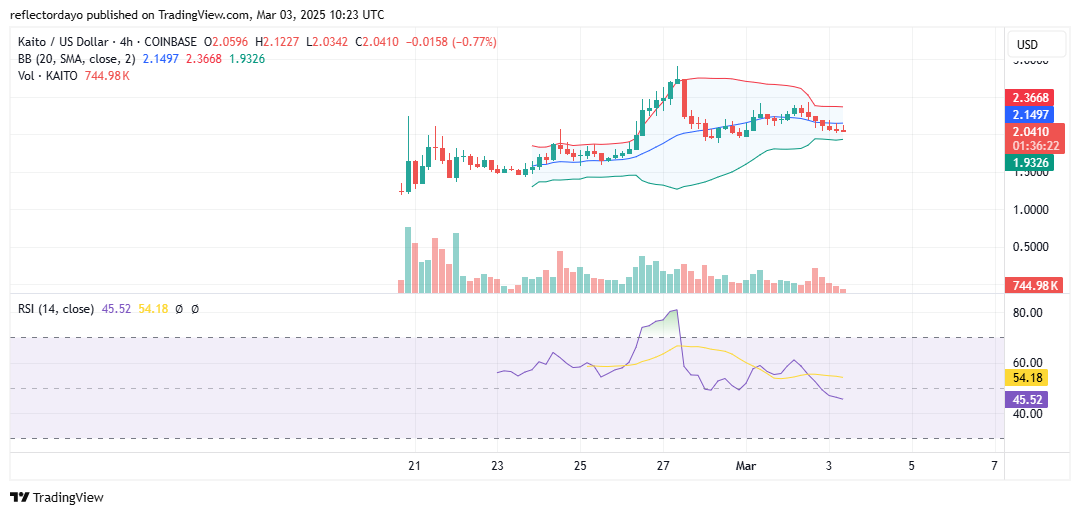
KAITO/USD Price Prediction: 4-Hour Chart Analysis
From a 4-hour chart perspective, we observe that following the emergence of resistance at the $2.50 level, a support level has also formed at $2.00. This suggests the possibility of a consolidation phase developing around this critical price zone.
Notably, price action loses momentum as it approaches the $2.00 support level. If the price continues to hold along this range, the likely outcome is a bounce, with a potential rally toward the $2.50 resistance.
On this timeframe, the Bollinger Bands indicate a narrowing bandwidth, signaling reduced volatility. Additionally, the Relative Strength Index (RSI) shows price action below its midpoint, currently below the 50 level and the 20-day moving average. However, bearish momentum appears to be weakening as the price nears $2.00, suggesting that a bounce could follow as bulls begin to assert strength at this support level.