Bitcoin (BTC/USD) Market Pushes in a Bullish-Straight Path
Estimated Reading Time: 3 minutes
Don’t invest unless you’re prepared to lose all the money you invest. This is a high-risk investment and you are unlikely to be protected if something goes wrong. Take 2 minutes to learn more
Bitcoin Price Prediction – January 18
A lot of effort has been put in by the BTC/USD trade long-position movers as the crypto market pushes in a bullish-straight path over the lower-trading range-bound zones in the recent operation. The positive trading momentum has continued to be between $21,549.01 and $21,120.46 at an average percentage rate of 1.16. That means selling activities are yet to regain their positions.
BTC/USD Market
Key Levels:
Resistance levels: $22,500, $23,500, 24,500
Support levels: $19,500, $18,500, $17,500
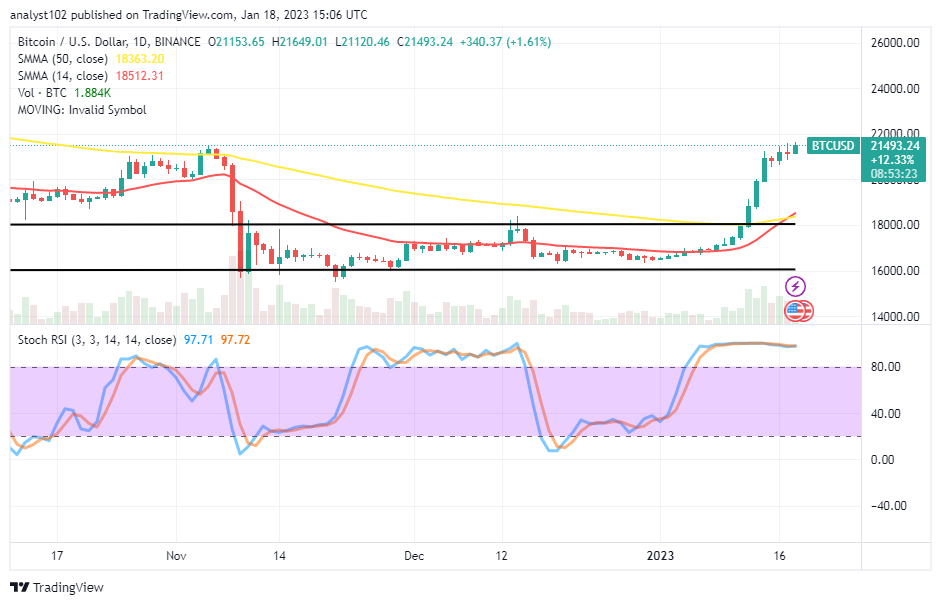
BTC/USD – Daily Chart
There has been a conjoining link in a series of variant bullish candlesticks formed on the BTC/USD daily chart, revealing that the market pushes in a bullish-straight path over the trend lines of the SMAs. The current situation portends a slight crossover between the SMA trading indicators as the 14-day thread is at $18,512.31 above the $18,363.20 value line of the 50-day thread. The Stochastic Oscillators are in the overbought region, moving in a consolidation style to denote that an upward-increasing force is on the rise until the moment of writing this analytical article.
At what point will a change in the BTC/USD market’s positive trading outlook be nullified?
Confirmation of a decline resumption in the BTC/USD trade operation will have to be when a bearish candlestick eventually occurs against the 14-day SMA indicator, as currently, the crypto market pushes in a bullish-straight path far over the SMA indicators. Buyers are in a higher note capacity of domineering outlook at the expense of bears’ weaknesses. In the meantime, entry for buying orders isn’t visible despite the northward pressures.
On the southward-moving side of the BTC/USD market technical analysis, short-position takers are to put off from placing an order for a while at this moment. The reason being that there has been no reliable formation to project the potentiaslity of getting a stable stance capable of opposing the current uprisings in the level of the crypto’s valuation. That said, if a bearish trading candlestick returns to engulf some of the bullish penultimate candlesticks from a top-resistance trading zone, then, bears may build along its path for making entres in the process.
BTC/USD 4-hour Chart
The BTC/USD medium-term chart showcases the crypto market pushes in a bullish-straight path over the SMA trend lines. The 14-day SMA indicator is $20,776.83 above the $18,968.07 point of the 50-day SMA indicator. The Stochastic Oscillators have moved southbound into the oversold region to consolidate. That appears that the momentum-building mode to the upside has not weakened.
Note: Cryptosignals.org is not a financial advisor. Do your research before investing your funds in any financial asset or presented product or event. We are not responsible for your investing results.
You can purchase Lucky Block here. Buy LBLOCK