Bitcoin (BTC/USD) Market Is Lagging Beneath $18,000
Estimated Reading Time: 3 minutes
Don’t invest unless you’re prepared to lose all the money you invest. This is a high-risk investment and you are unlikely to be protected if something goes wrong. Take 2 minutes to learn more
Bitcoin Price Prediction – January 10
After a line of variations in the way the BTC/USD trade operations have taken to, the crypto market is now lagging beneath the $18,000 resistance point as it has tried to rally slightly over the $17,000 trading zone. As of writing, there is a sign of positivity about the trading zone price keeps at a minute average perecentage rate of 0.58..
BTC/USD Market
Key Levels:
Resistance levels: $18,000, $19,000, $20,000
Support levels: $16,000, $15,000, $14,000
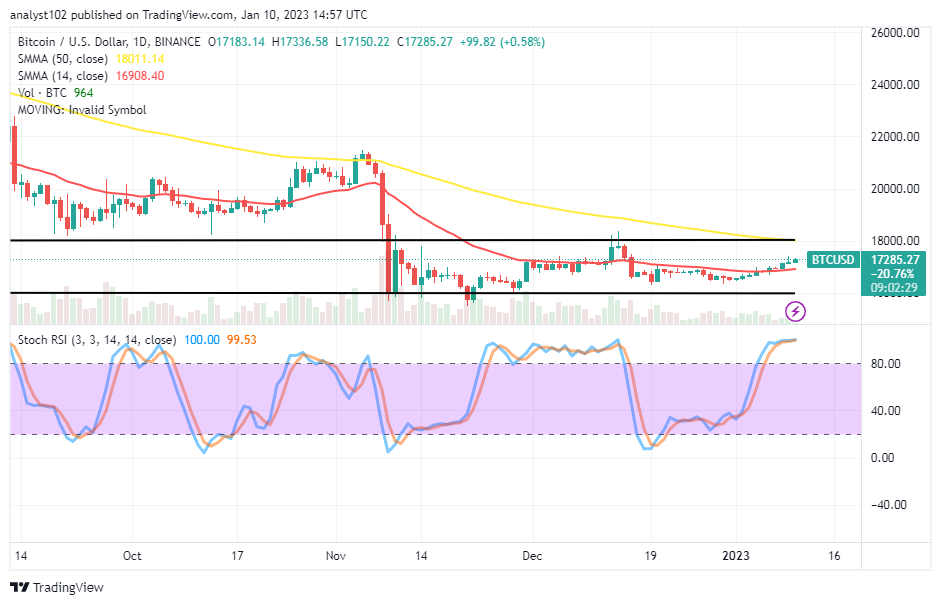
BTC/USD – Daily Chart
The daily chart reveals the BTC/USD market is lagging beneath the $18,000 resistance level of the upper range trading spot. The range lines drew up and down to mark the sideways operations of the trade over time. The range lines were drawn up and down over time to represent the trade’s sideways movements. Under the 50-day SMA indicator’s value line of $18,011.14, the 14-day SMA trading indicator is at $16,908.40. The Stochastic Oscillators are at levels of 99.53 and 100 to the north while intensifying their presence in the overbought area.
Has there been evidence that the current BTC/USD trade activity will soon stop on the rise?
In the face of factual obtainable thought, there have been no signs to counter the rallying motion as the BTC/USD market lags beneath the $18,000 resistance line. In the meantime, long-position placers won’t as well be able to detect a longing order entry under the current pulling-up pace setting. An abrupt pull-down move may soon occur as envisaged over a couple of sessions.
On the depreciation-moving side of the BTC/USD market technical analysis, a bearish trading candlestick has to form around or close below the barrier of $18,000. And in the process of that sentiment coming forth, the 14-day SMA will have to breach southward to add more to the presumed falling scenario o. In contrast to such presumptions, the price will either deteriorate into a static view below the 50-day SMA or grow gradually.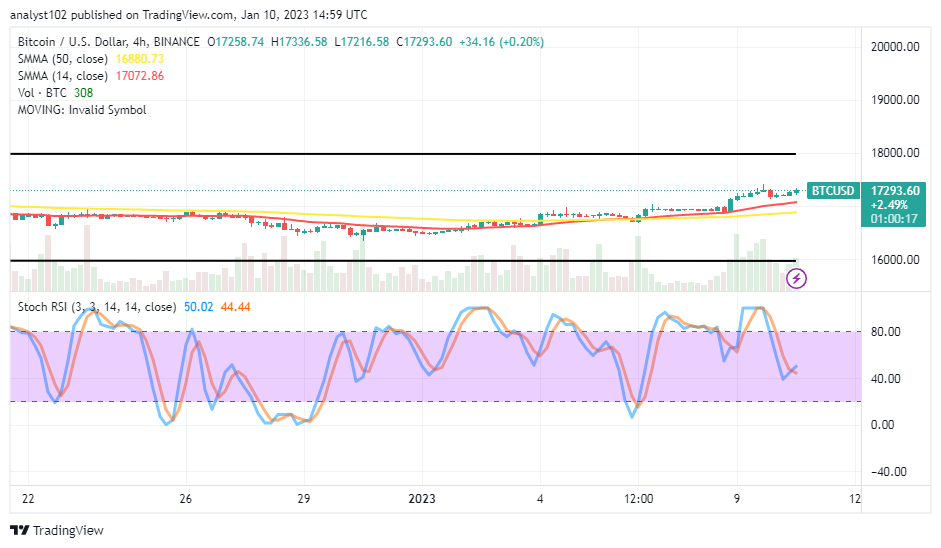
BTC/USD 4-hour Chart
The BTC/USD medium-term chart mirrors the crypto market is lagging beneath the $18,000 resistance level. Presently, the US Dollar positions are yet to make an active impact against the most valuable crypto economy. The candlesticks that have surfaced signify that some smaller-northward moves feature not too far away on the trend lines of the SMAs. The 14-day SMA indicator has crossed the 50-day SMA indicator to the upside. The Stochastic Oscillators have moved southbound from the overbought region, now trying to cross their lines back to the north at 44.44 and 50.02 levels. It appears buying actions may still hold somewhat firmer in the meantime.
Note: Cryptosignals.org is not a financial advisor. Do your research before investing your funds in any financial asset or presented product or event. We are not responsible for your investing results.
You can purchase Lucky Block here. Buy LBLOCK