Bitcoin (BTC/USD) Market Remains to Hover in Range-Bound Points
Estimated Reading Time: 3 minutes
Don’t invest unless you’re prepared to lose all the money you invest. This is a high-risk investment and you are unlikely to be protected if something goes wrong. Take 2 minutes to learn more

Free Crypto Signals Channel
Bitcoin Price Prediction – June 8
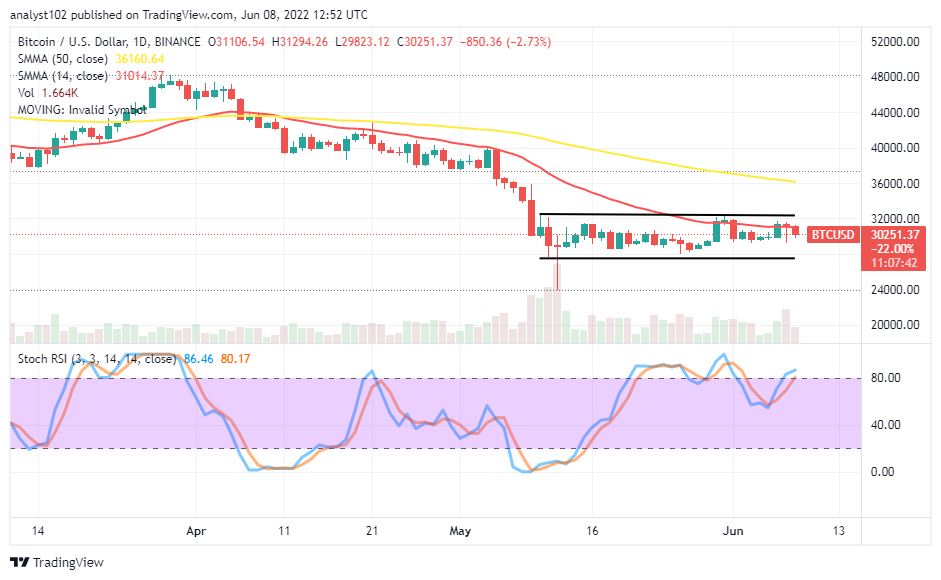
The BTC/USD market remains to hover in range-bound points that it has concurrently kept over time. The market price has touched a high value of $31,294 as well as a low-value line of $29,823, maintaining a negative percentage rate of 2.73. Most signals showcase a bearish move presently.
BTC/USD Market
Key Levels:
Resistance levels: $32,500, $35,000, $37,500
Support levels: $27,500, $25,000, $22,500
BTC/USD – Daily Chart
The BTC/USD daily chart reveals the market remains to hover in range-bound points. Several rejections have surfaced around the smaller SMA trend line beneath the upper range line at the $32,500, which also served as the firm resistance level to upward risings in the crypto’s price valuation. The 14-day SMA indicator is underneath the 50-day SMA indicator. The Stochastic Oscillators are around the range of 80, attempting to bend down the lines.
Can the BTC/USD market bears push southward more outside the long-ranging zones afterward?
Based on the BTC/USD market trending force outlook, it appears there is room for selling pressures if bulls continue to expose to making a failing attempt to breach northward past the upper range line at $32,500 sustainably. So much attention is needed to draw closer to the lower range line at $27,500 while the price averages it either for a test or a continual downward trending movement. Long-position takers have to look out for a clear-cut decision of whether a rebound will be around the lower point or not before considering launching a buying order.
On the downside of the technical analysis, short-position takers may rely on any active reversal motion that is possible to feature around the positioning of the upper range line and the 14-day SMA trend line. However, an attempt of a consolidation movement around those indicators’ points by bulls may allow the BTC/USD market bulls to boost up the energy to rally northward in a light-weighted move above them in the long run.
BTC/USD 4-hour Chart
The BTC/USD medium-term chart showcases the market remains to hover in range-bound points marked at $32,500 and $27,500 levels. The 14-day SMA trend line has conjoined with the 50-day SMA trend line within the range-bound spots. The Stochastic Oscillators are around the 40 range to denote the trade is experiencing a pause for now. The current situation suggests price is on the course of finding a support baseline within the range-bound spots, especially toward the lower range-trading level.
Note: Cryptosignals.org is not a financial advisor. Do your research before investing your funds in any financial asset or presented product or event. We are not responsible for your investing results.
“Lucky is up more than 50% today but still more than 430% from All Time Highs!
The opportunity to bank BIG is now!
You can purchase Lucky Block here. Buy LBlock