Bitcoin (BTC/USD) Market Reverses Slightly
Estimated Reading Time: 3 minutes
Don’t invest unless you’re prepared to lose all the money you invest. This is a high-risk investment and you are unlikely to be protected if something goes wrong. Take 2 minutes to learn more
Bitcoin Price Prediction – October 13
It has now been barely a week and some days back that the BTC/USD economic price embarked upon an increasing moving mode. However, the market now reverses slightly in bullish channel trend lines at a negative percentage rate of 2.36, trading around the line of $54,844.
BTC/USD Market
Key Levels:
Resistance levels: $57,500, $60,000, $62,500
Support levels: $52,500, $50,000, $47,500
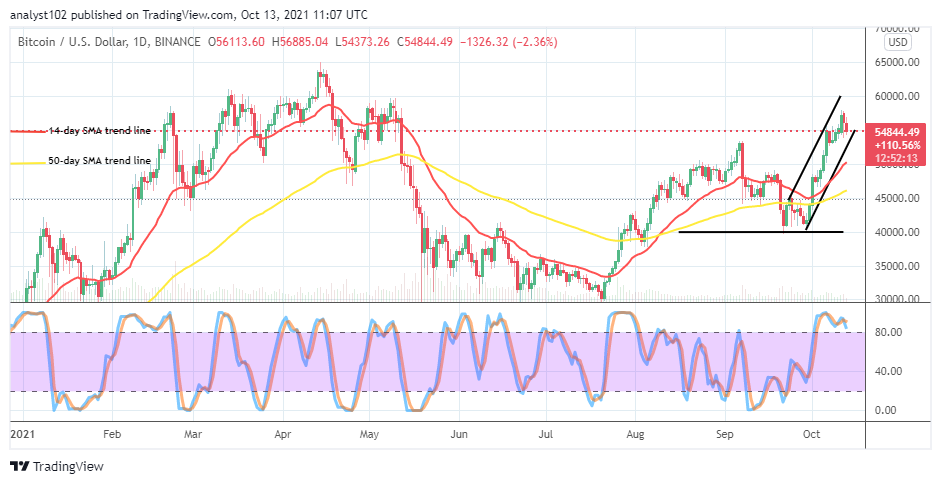
BTC/USD – Daily Chart
The BTC/USD daily chart reveals that the crypto-economic market reverses slightly within the confinement of the bullish channel trend lines. The 14-day SMA indicator has briefly protruded northward past the value line at $50,000 above the 50-day SMA indicator. The Stochastic Oscillators are in the overbought region, consolidating. But, they now seemingly are trying to cross southbound. That signifies that the market may soon suffer some setbacks in its valuation.
Could it be that the BTC/USD price will soon witness more downward pressures as the market reverses slightly?
The BTC/USD price has been encountering series of rejections at a higher trading line as the market reverses slightly. The crypto market now trades against a $55,000 line to the south side, where the lower bullish trend line is the crucial trading level. Therefore, buyers should brace up their muscles against any abrupt breakdown or a slow systemic price motion that could emerge around the value line.
On the downside analysis, there have been indications signifying that the crypto economy has reached one of its topmost values. And that will have to warrant retracement motions that can metamorphose into a momentary bearish trend. Sellers would have to watch out for firm holding of the market beneath $55,000 level coupled with active pressures denoting featuring of downs.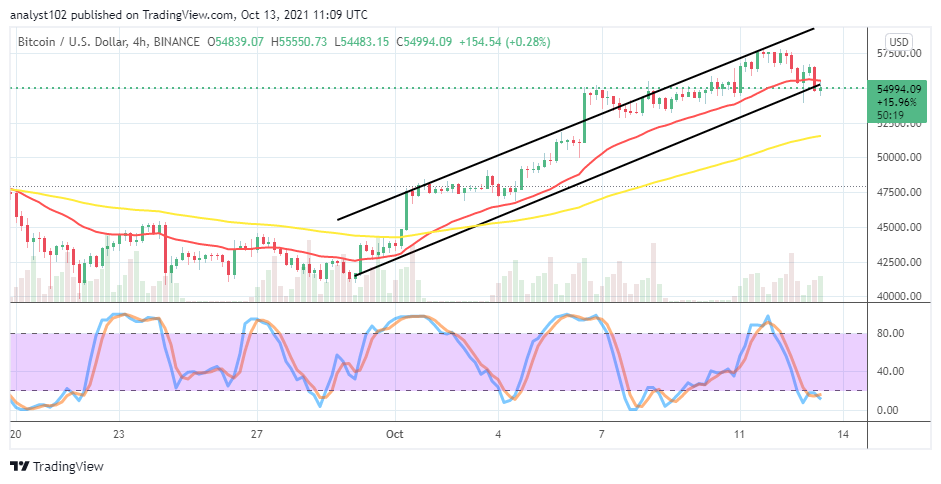
BTC/USD 4-hour Chart
The BTC/USD 4-hour chart reveals that the crypto market reverses slightly to touch both the smaller SMA and the lower bullish trend lines. The 50-day SMA indicator is underneath the 14-day SMA indicator. The Stochastic Oscillators are in the oversold region with closed lines. The market level at $55,000 stands to play a role in determining the subsequent price direction. A long-holding consolidation moving mood of the market around that point may eventually lead to letting price get cuts.
Note: Cryptosignals.org is not a financial advisor. Do your research before investing your funds in any financial asset or presented product or event. We are not responsible for your investing results.
You can purchase crypto coins here. Buy Tokens