Bitcoin (BTC/USD) Market Volatility Index Is Decreasing
Estimated Reading Time: 3 minutes
Don’t invest unless you’re prepared to lose all the money you invest. This is a high-risk investment and you are unlikely to be protected if something goes wrong. Take 2 minutes to learn more
Bitcoin Price Prediction – November 30
There has been a less-active moving mode in the BTC/USD trade transactions over a certain period as the crypto market volatility index is decreasing below the $18,000 resistance line. In the most recent trading session, prices ranged from $17,971.13 to $16,429.15, maintaining a positive percentage rate of 2.36.
BTC/USD Market
Key Levels:
Resistance levels: $18,000, $19,000, $20,000
Support levels: $16,000, $15,000, $14,000
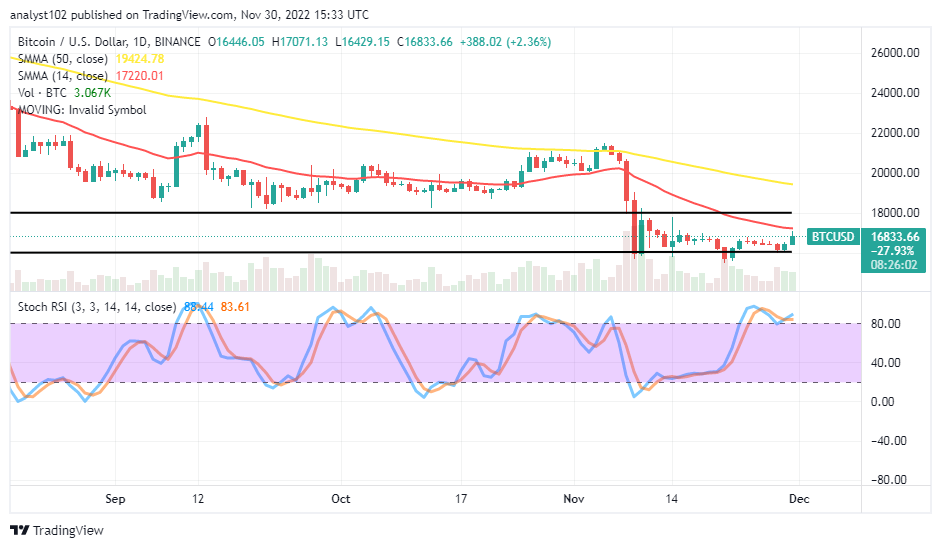
BTC/USD – Daily Chart
The BTC/USD daily chart shows that the crypto market volatility index is decreasing underneath the $18,000 resistance level. The 14-day SMA indicator has traveled southward past the point to place around $17,220.01 under the $19,424.78 value line of the 50-day SMA indicator. The upper horizontal line drew at the market resistance point earlier mentioned, while the lower horizontal line is at the $16,000 support level. The Stochastic Oscillators are moving in a consolidation manner at 83.61 and 88.44 levels to show that buying pressure is relatively ongoing.
Will there be a long-holding of positions above the $16,000 baseline spot in the BTC/USD market?
It has been that the reading posture of the Stochastic Oscillators that the BTC/USD trade has been getting a weak sign to the upside as the crypto market volatility index is decreasing below the $18,000 resistance level. In the meantime, the $16,000 support level is equally not too far from a free fall-off that can happen in no time. Like wisely, a sudden breakout at the 14-day SMA’s point at $17,220.01 may let buyers push through some high resistances in the process.
On the negative side of the BTC/USD market’s technical analysis, bears may stage a comeback around the smaller SMA’s trend line, testing the $18,000 resistance level before continuing their active descending trend afterward. On the negation note, if a bullish form holds against that assumption, sellers will have to relax efforts for some time until a rejection pattern emerges.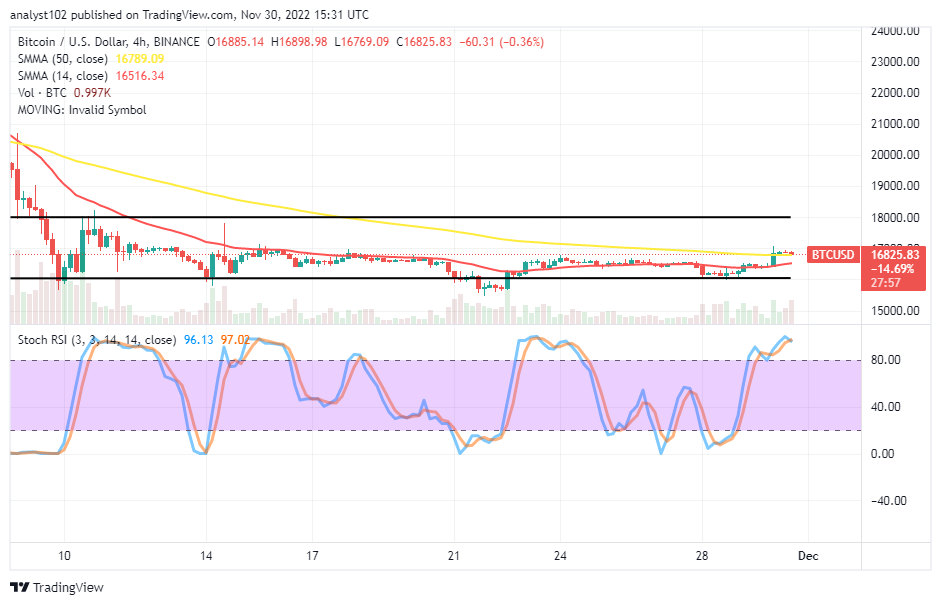
BTC/USD 4-hour Chart
The BTC/USD medium-term chart depicts the crypto market volatility index decreasing underneath the $18,000 resistance level. Severally, the price has been losing stances around $17,000. The 14-day SMA indicator is at $16,516.34, underneath the $16,789.09 value point of the 50-day SMA indicator. The lower range line drew at the $16,000 support level, indicating it as the current pivotal zone to subsequent possible downs. The Stochastic Oscillators are in the overbought region, showing that there can be a falling force at 97.02 and 96.13 levels.
Note: Cryptosignals.org is not a financial advisor. Do your research before investing your funds in any financial asset or presented product or event. We are not responsible for your investing results.
You can purchase Lucky Block here. Buy LBLOCK