Bitcoin (BTC/USD) Price Declines to Approach $20,000 Support
Estimated Reading Time: 3 minutes
Don’t invest unless you’re prepared to lose all the money you invest. This is a high-risk investment and you are unlikely to be protected if something goes wrong. Take 2 minutes to learn more

Free Crypto Signals Channel
Bitcoin Price Prediction – June 15
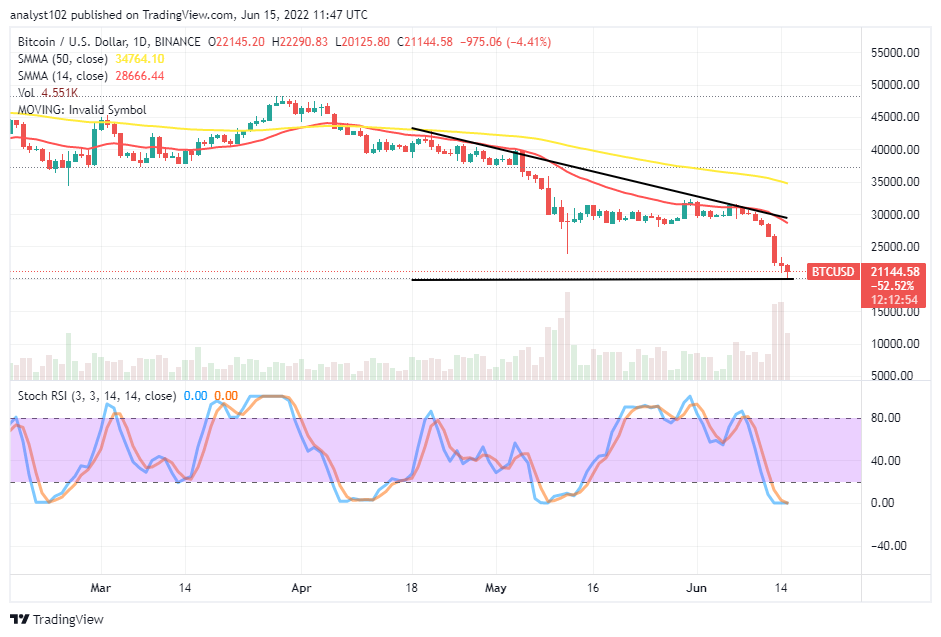
The BTC/USD market price declines to approach the $20,000 support line in today’s ongoing trading session. Price is trading between $22,290 and $20,125 value lines at a negative percentage rate of 4.41.
BTC/USD Market
Key Levels:
Resistance levels: $22,500, $25,000, $27,500
Support levels: $20,000, $17,500, $15,000
BTC/USD – Daily Chart
The BTC/USD daily chart reveals the crypto-economic price declines to approach the $20,000 support level. The bearish trend line drew tightly around the smaller SMA trend line. The 50-day SMA indicator is above the 14-day SMA indicator. The horizontal line drew at the value line to keep a tab of bears’ reactions in the market around it. The Stochastic Oscillators are in the oversold region, dipping outlook within it until the present.
Has there been a recovery sign in the BTC/USD market operation?
There has been no recovery sign in the BTC/USD market operations as the crypto’s price declines, approaching the $20,000 support level. Despite the reading of an oversold condition of this pairing trading instrument, variant bearish candlesticks have continued to emerge, signaling against the expectation of having a rebound in no time. Based on that situation, it would be technically ideal for buyers to stay off, placing new positions until a bullish candlestick features to confirm an end to the current falling force at a lower-trading zone.
On the downside, technical analysis of the BTC/USD market, the falling forces are still intense for bulls to push back northward. Therefore, selling entries would be the only concern for sellers. A smaller time frame on the chart will allow traders to get a timely entry order. Traders will also have to back their execution of orders with active price action.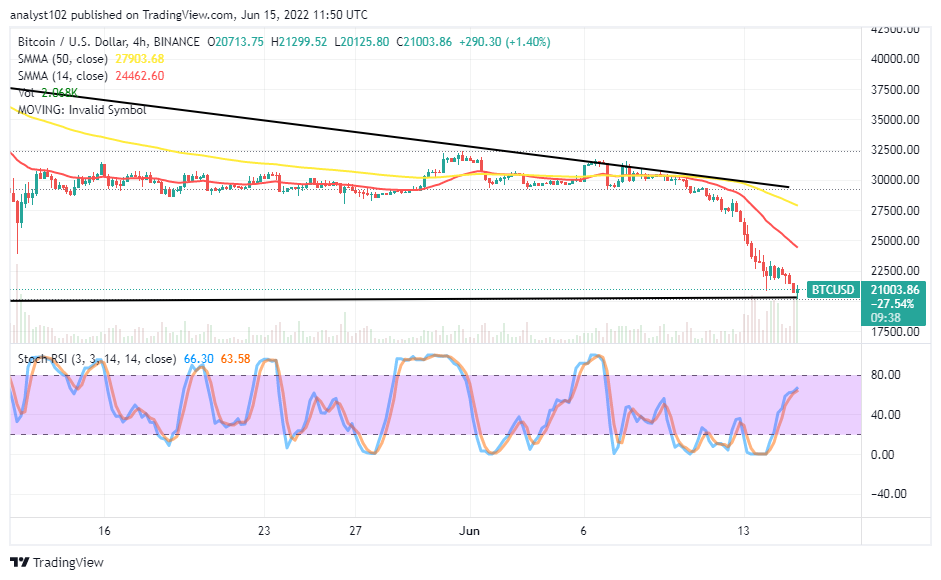
BTC/USD 4-hour Chart
The BTC/USD medium-term chart reveals the crypto-economic price declines to approach the $20,000 support level. The 14-day SMA indicator is underneath the 50-day SMA indicator. And they are far above the current trading zone. The stochastic Oscillators are close to the range of 80 from the beneath. Variant trading candlesticks have been garnering between $22,500 and $20,000 value lines to decide what can be the next direction of trading after a while.
Note: Cryptosignals.org is not a financial advisor. Do your research before investing your funds in any financial asset or presented product or event. We are not responsible for your investing results.
“Lucky is up more than 50% today but still more than 430% from All Time Highs!
The opportunity to bank BIG is now!
You can purchase Lucky Block here. Buy LBlock