Bitcoin (BTC/USD) Price Fluctuates Close to $35,000
Estimated Reading Time: 3 minutes
Don’t invest unless you’re prepared to lose all the money you invest. This is a high-risk investment and you are unlikely to be protected if something goes wrong. Take 2 minutes to learn more
Bitcoin Price Prediction – July 7
The BTC/USD price fluctuates continually close to the value of $35,000 to trade around the line of $34,538. As of writing, the crypto’s valuation maintains a percentage increase rate of 2.26.
BTC/USD Market
Key Levels:
Resistance levels: $37,500, $42,500, $47,500
Support levels: $30,000, $27,500, $25,000
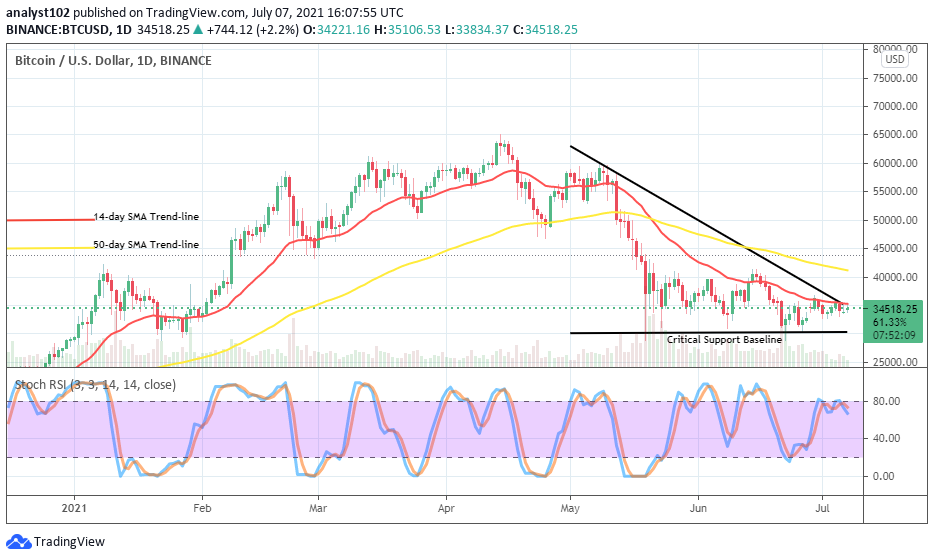
BTC/USD – Daily Chart
The BTC/USD daily chart reveals that the valuation of the flagship crypto pairing with that of the American fiat currency fluctuates around the same level that it has been keeping over time. The bearish trend-line with the smaller SMA has positioned at the trading area to make a markdown where the BTC/USD price fluctuates close to $35,000. The 50-day SMA trend-line is over the 14-day SMA trend-line. The Stochastic Oscillators are seeming, consolidating near below the range of 80 to create a line of smaller-ups and smaller-downs around the market’s value earlier mentioned. That also portends that a kind of indecision is ongoing around that trading area.
When will there be a volatile movement in the BTC/USD market operations as price fluctuates presently?
There has been no definite and reliable trade signal to portend a near trading situation far away from the value of $35,000 presently as the price fluctuates close to it. However, a push downward or a line of downward-pushes below the point earlier mentioned could, in the long lead to finding support for rebounding moves that bulls may make use of. The critical support baseline at $30,000 appears valid in the presumed aftermath determination of a decent upward-positioning point of entry.
On the downside of technical analysis, the current point of $35,000 needed to witness more pressures by the BTC/USD bears if the current trend has to push further in a bearish motion. And, it is, the Stochastic Oscillators keep the suggestion rising as their consolidation movement around the range of 80 somewhat signals some degrees of lapses in bulls’ energies currently in the crypto economy.
BTC/USD 4-hour Chart
It is depicted on the BTC/USD medium-term chart that the crypto’s price fluctuates close to the level of $35,000. It also shown that the crypto market is relaxing momentum at a vital point alongside the bearish trend-line drew over the SMAs. The 14-day SMA trend-line has conjoined with the 50-day SMA indicator from underneath. The Stochastic Oscillators are in the overbought region with the two lines closed, attempting to point southbound. That signifies that the crypto trade may still go downsizing at a later session.
Note: new.cryptosignals.org is not a financial advisor. Do your research before investing your funds in any financial asset or presented product or event. We are not responsible for your investing results.
You can purchase crypto coins here. Buy Tokens