Bitcoin (BTC/USD) Price Hovers at $55,000
Estimated Reading Time: 3 minutes
Don’t invest unless you’re prepared to lose all the money you invest. This is a high-risk investment and you are unlikely to be protected if something goes wrong. Take 2 minutes to learn more
Bitcoin Price Prediction – November 28
Currently, the BTC/USD market’s price hovers around $55,000 trading line in a bid to push for more slight downs. The crypto-economic trade, as of writing, witnesses a volume worth about $54,488 at a smaller percentage rate of around 0.97 positives. That indicates that the market, despite the current downward corrections, still manages to make some minute-ups.
BTC/USD Market
Key Levels:
Resistance levels: $57,500, $60,000, $62,500
Support levels: $52,500,$50,000, $47,500
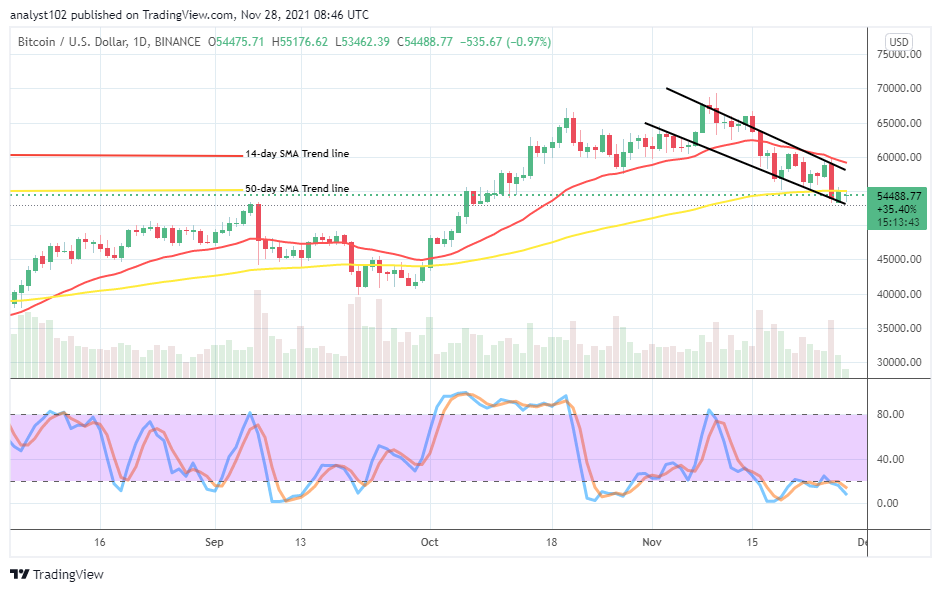
BTC/USD – Daily Chart
The BTC/USD daily chart showcases that the crypto’-economic price hovers at $55,000 as it has been against the valuation of the US Dollar. The 14-day SMA indicator has slightly bent southward against the $60,000 level above the 50-day SMA indicator. The bearish channel trend lines drew to adjudge the path of the correction that the market keeps. The Stochastic Oscillators are in the oversold region, consolidating in it as there have been few occasions that they’ve made false attempts to move northbound away from the range of 20. That signifies that the consolidation movement tends to linger on more for a while.
Will the BTC/USD market push southward further as the crypto-economic price hovers at $55,000?
It suggested that traders await the subsequent BTC/USD trade action to denote the definite direction that the market may result in as the crypto-economic price hovers at the $55,000 level presently. As a result of that sentiment, bulls will have to be on the lookout for when there will be active rebounding motions, emerging from a lower trading spot beneath the value line before going for long position entries.
On the downside of technical analysis, a long-hold of consolidation moving outlook will have a feature on a long-term basis of around $55,000 to keep the market vulnerable to a further panic sell-off trading situation afterward. A violent dumping motion beneath the value line may set the market up for more lows in the long run. But, one thing that is catching an eye is that the current trading level could serve as the line that bulls are preparing to make re-pushes.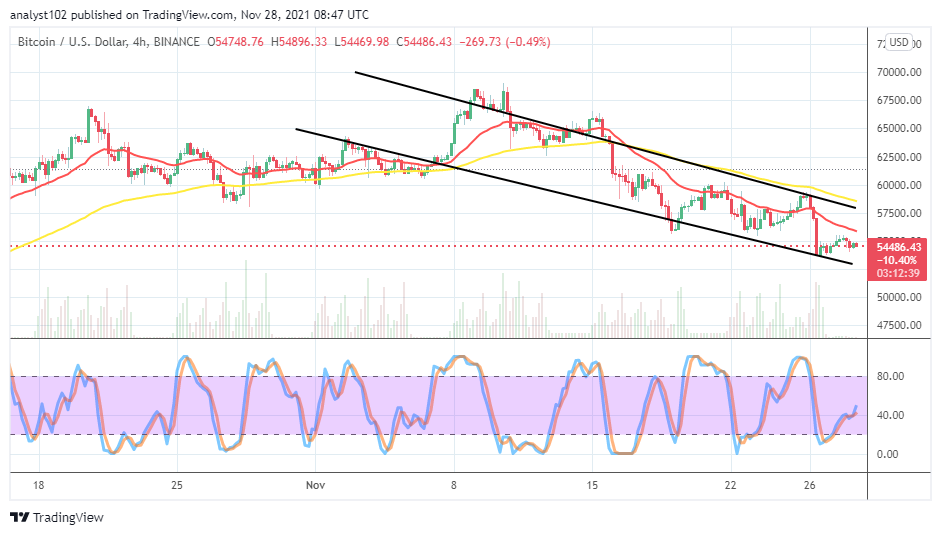
BTC/USD 4-hour Chart
The BTC/USD 4-hour chart shows that the crypto economy moves in a bearish outlook as the price hovers around $55,000. The 14-day SMA trend line is underneath the 50-day SMA trend line. The Stochastic Oscillators are around the range of 40, trying to get reshaped. That suggests that the need that traders should be cautious of exerting any trading position at this point. A retest of $52,500 support level can lead to decent bounce-offs that bulls may eventually capitalize on.
Note: Cryptosignals.org is not a financial advisor. Do your research before investing your funds in any financial asset or presented product or event. We are not responsible for your investing results.
You can purchase crypto coins here. Buy Tokens