UMA (UMAUSD) Is Struggling to Reform Against the Bearish Tide
Estimated Reading Time: 2 minutes
Don’t invest unless you’re prepared to lose all the money you invest. This is a high-risk investment and you are unlikely to be protected if something goes wrong. Take 2 minutes to learn more

Free Crypto Signals Channel
UMA Analysis – Price Is Struggling to Regain a Bullish Market Position
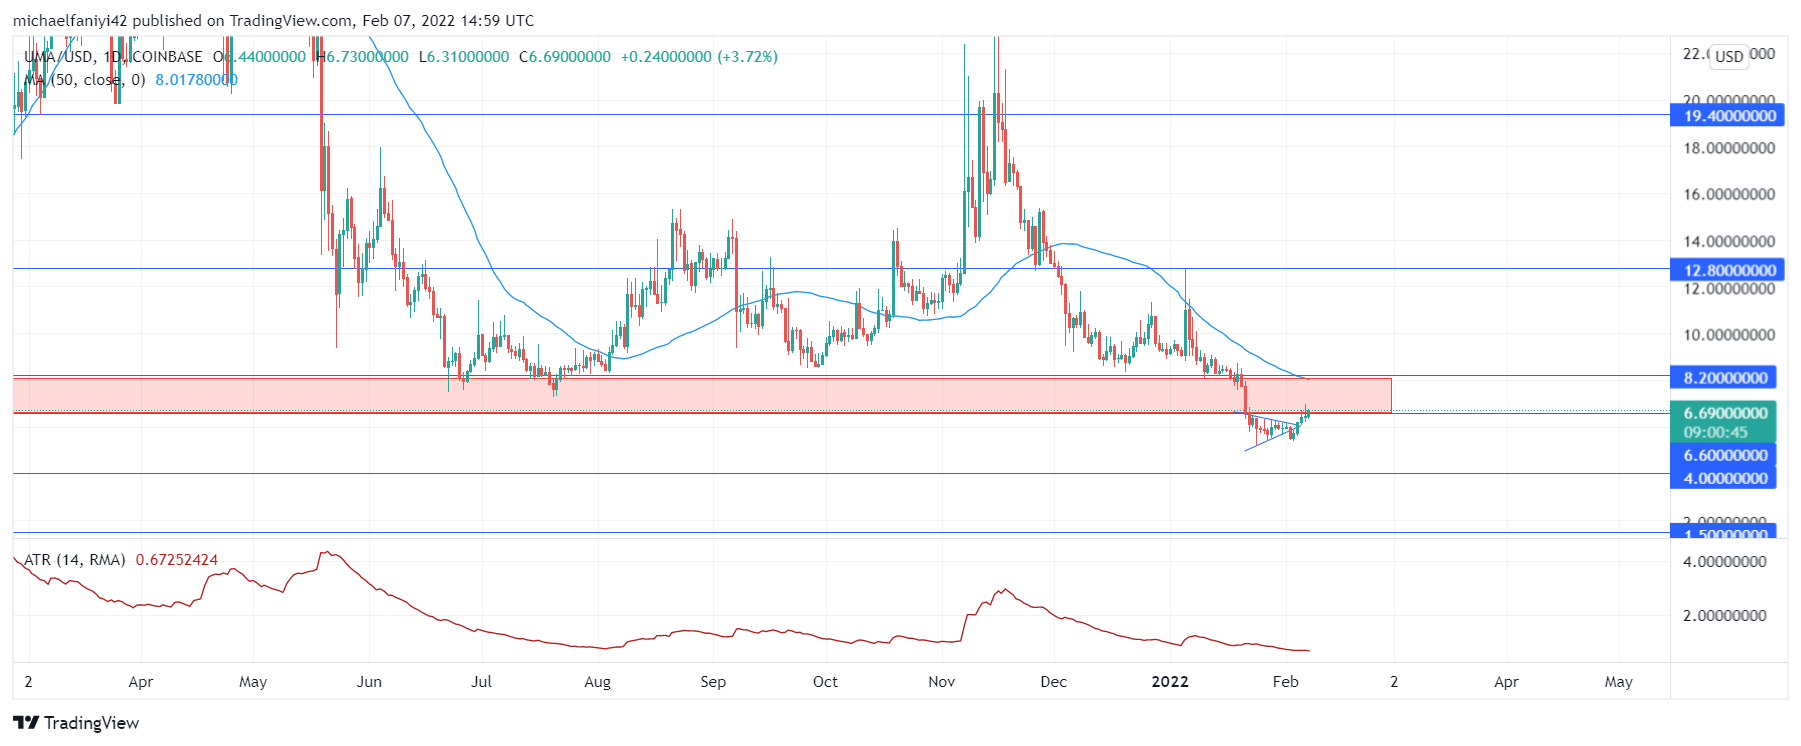
UMA is struggling to reform against the current bearish tide as it pushes hard against the major market resistance zone. The strong market zone lies at $8.200 to $6.600. For a while, it initially acted as market support, till the market forcefully plummeted through it. The buyers stepped in immediately, just below the market zone to cause a correction against the bearish tide.
UMA Important Levels
Resistance Levels: $12.800, $8.200
Support Levels: $4.000, $1.500
The market’s bearish tide became stronger as the price slipped below the $12.800 critical level. This is evident as the UMA was rejected from rising above it. This caused the market tide to put pressure on the strong support level at $8.200. The pressure was persistent from mid-December 2021 to mid-January 2022. This eventually led to a break of the support level down below $6.600.
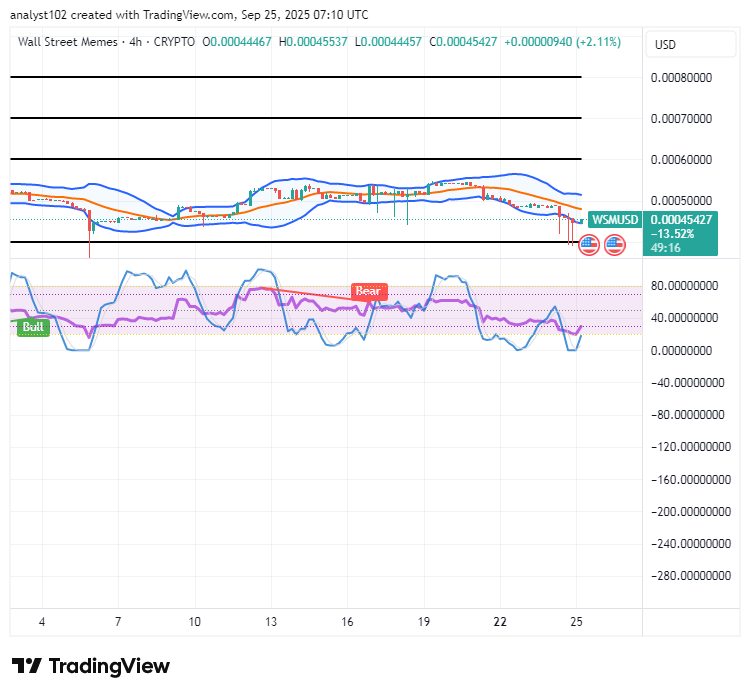
Immediately after dropping below the support range, the tide was steamed such that buyers began struggling to regain the market. A triangle formation was used to push hard at a now unyielding $6.600 price level. The EFI (Elders Force Index) shows equilibrium in the market as its force line rests at zero level. Meanwhile, the RSI (Relative Strength Index) indicator is showing bullish endeavors from a bearish territory.

Market Expectations
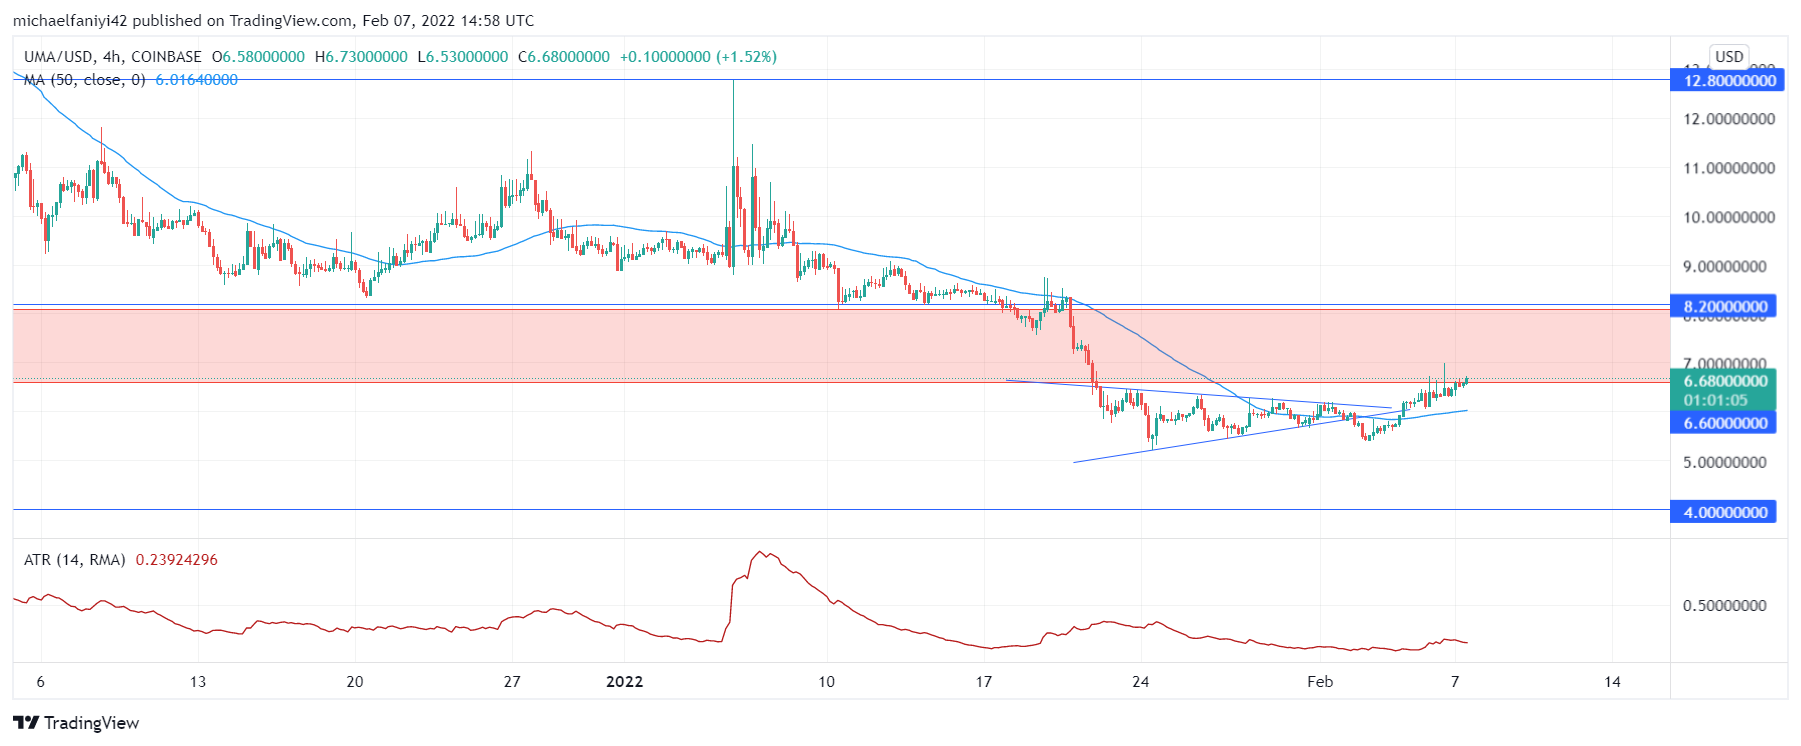
There is already a bullish bias on the 4-hour chart. The EFI shows there are more bulls than bears in the market in the smaller timeframe. The RSI line shows that the price has risen well into a bullish territory and is on the verge of being overbought. This means the bulls, who are currently struggling, can be backed to reform the market and drive it back through the range before more upward movements.
You can purchase crypto coins here: Buy Tokens
Note: Cryptosignals.org is not a financial advisor. Do your research before investing your funds in any financial asset or presented product or event. We are not responsible for your investing results.