Bitcoin (BTC/USD) Price Is Correcting in the Range-Bound Zones
Estimated Reading Time: 3 minutes
Don’t invest unless you’re prepared to lose all the money you invest. This is a high-risk investment and you are unlikely to be protected if something goes wrong. Take 2 minutes to learn more

Free Crypto Signals Channel
Bitcoin Price Prediction – August 10
The BTC/USD trade operation portends that the crypto-economic price is correcting in the range-bound zones featured over a couple of sessions. Price is currently trading around $22,906 within the low of $22,700 and a high of $23,190 as it keeps a 1.20% negative.
BTC/USD Market
Key Levels:
Resistance levels: $25,000, $27,500, $30,000
Support levels: $20,000, $17,500, $15,000
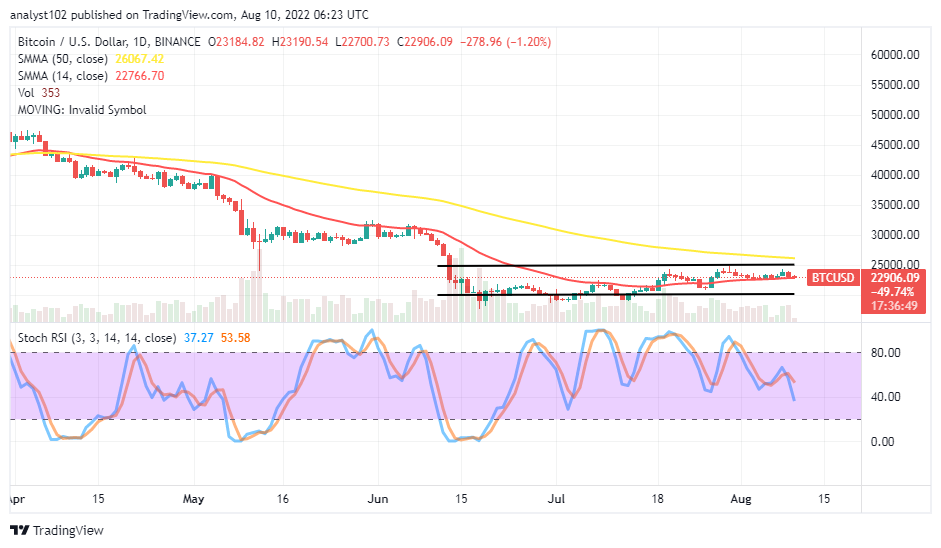
BTC/USD – Daily Chart
The BTC/USD daily chart showcases the crypto’s price is correcting in the range-bound zones of 20,000 and $25,000 that have witnessed variant ups and downs over time until the present. The smaller indicator is between the horizontal lines drawn to mark the upper and the lower range points. The 14-day SMA trend line is at $22,766.70, underneath the $26,067.42 value line of the 50-day SMA trend line. The Stochastic Oscillators have crossed southbound to reach the range of 40. It shows a declining motion is ongoing.
Will the BTC/USD market survive breaking down at the 14-day SMA’s value at $22,766.70 afterward?
The BTC/USD market will likely survive breaking through the value point of the 14-day SMA indicator at $22,766.70 if bears tend to intensify forces as the crypto’s price has resorted to correcting in the range-bound zones. The $20,000 lower range line remains the pivotal support baseline that the downward=trending movement may drop before finding a stand to rebuild an upward swing.
On the downside of the technical analysis, the BTC/USD market bears need to add more to the forces as the price is moving in a retracement toward the value line of the 14-day SMA indicator at $22,766.70. In the process that sentiment tends to play out, short-position placers should be wary of any possible rebound that can resurface against the point mentioned earlier.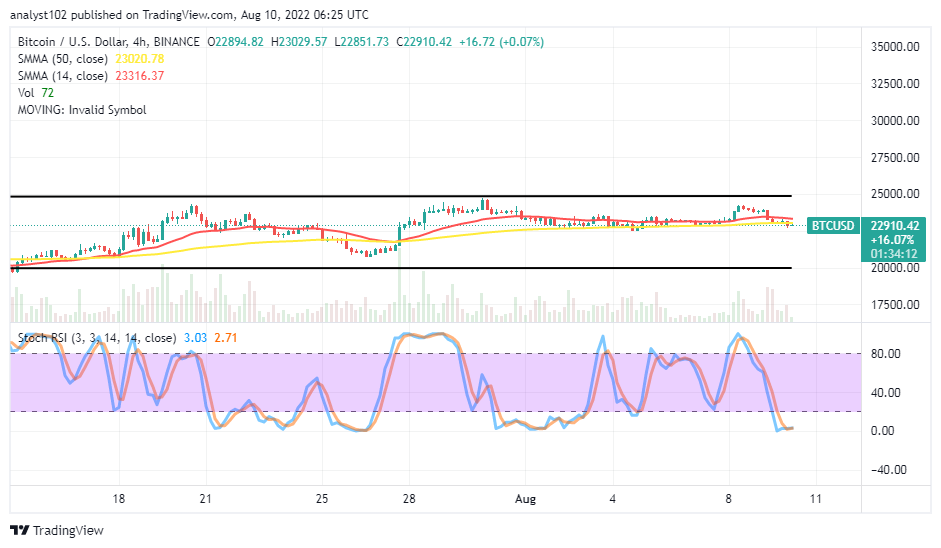
BTC/USD 4-hour Chart
The BTC/USD medium-term chart showcases the crypto market is correcting in the range-bound zones toward the mid-point of the trading area. The upper horizontal range line remains drawn at $25,000, and the lower horizontal line is at $20,000. And the 14-day SMA indicator is closely positioned over the 50-day SMA indicator within the range-bound trading spots. The Stochastic Oscillators have freshly moved into the oversold region to touch the range at zero. The situation still shows a relatively bearish-trading outlook, getting to a critical condition. Therefore, traders need to exercise patience at the moment.
Note: Cryptosignals.org is not a financial advisor. Do your research before investing your funds in any financial asset or presented product or event. We are not responsible for your investing results.
You can purchase Lucky Block here. Buy LBLOCK