Bitcoin (BTC/USD) Price Oscillates at $42,500
Estimated Reading Time: 3 minutes
Don’t invest unless you’re prepared to lose all the money you invest. This is a high-risk investment and you are unlikely to be protected if something goes wrong. Take 2 minutes to learn more

Free Crypto Signals Channel
Bitcoin Price Prediction – February 13
It currently recorded on the BTC/USD market financial book of records that the crypto-economic price oscillates at $42,500 over a couple of sessions. The market has been pushing between the high and low points of $42,547 and $42,107 at a minute positive percentage of 0.41.
BTC/USD Market
Key Levels
Resistance levels: $45,000, $47,500, $50,000
Support levels: $40,000, $37,500, $35,000
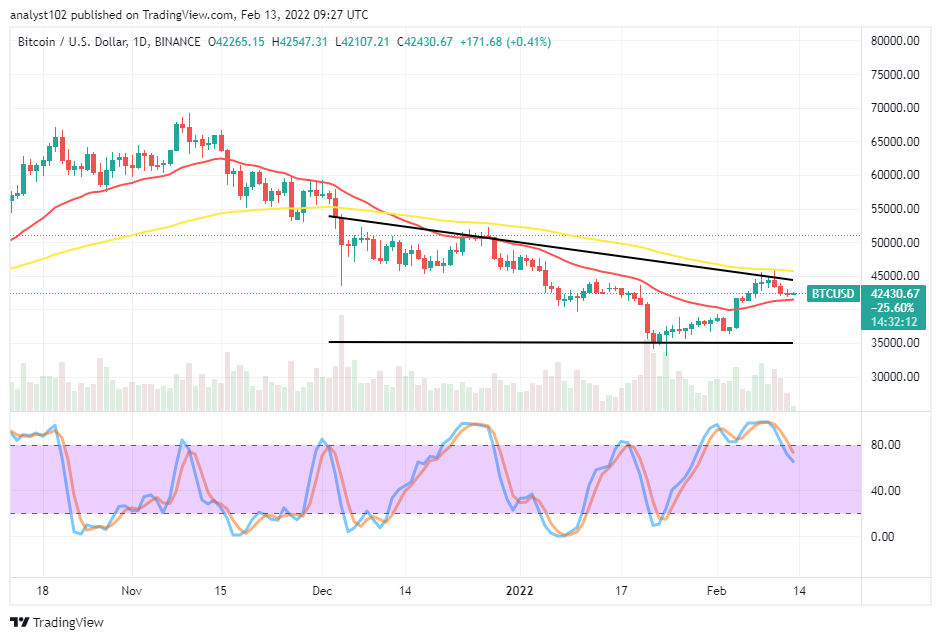
BTC/USD – Daily Chart
The BTC/USD daily chart reveals that the crypto market operation price oscillates at $42,500 after hitting resistance around the $45,000 level. The bearish trend line drew closely beneath the trend line of the bigger SMA. The 14-day SMA trading indicator is underneath the 50-day trading SMA indicator. The Stochastic Oscillators have crossed lines southbound from the overbought region against the range of 80, indicating a relatively moving force is ongoing.
Will the BTC/USD market operation regain momentum to the upside as the crypto-economic price oscillates at $42,500?
The regaining momentum probability of the BTC/USD market operation to the upside appears not to carry many forces to raise a fearful trading condition that price may sustainably stay above some resistances afterward. In the meantime, the market would have to build up catalyst around the $40,000 level to resurface an upward pressure.
On the contrary to rebuilding energy around the $40,000 trading level, a sudden breakdown at the value line will put the crypto activities into lower trading zones of variant support levels. In the long run, the market may push southward past the trend line of the 14-day SMA to revisit the previous low support of around $35,000. Traders intending to ride alongside the presumed downward motion would have to be on the lookout to join the move as early as possible to avoid unnecessary bears’ trap in no time.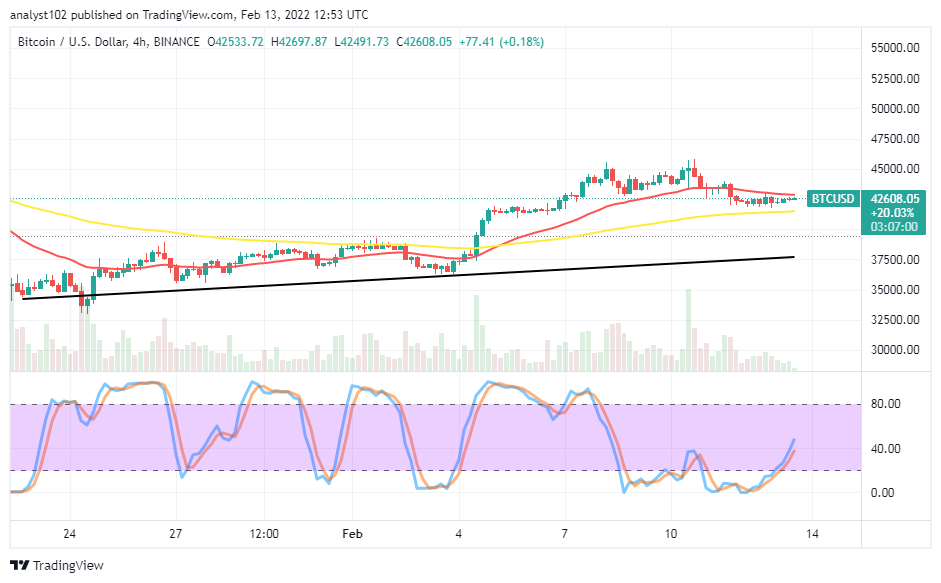
BTC/USD 4-hour Chart
The BTC/USD medium-term chart showcases the crypto-economic price oscillates at $42,500. The trading situation is taking closely beneath the trend line of the 14-day SMA above the 50-day SMA indicator. The bullish trend line drew underneath the SMA trend lines indicates that price is yet to downturn its recently rebounding momentums The Stochastic Oscillators have slantingly crossed northbound from the oversold region slightly against the range of 40. That indicates that a northward pressure may still occur. Therefore, shorting order may have to suspend for a while if that assumption plays out as signified by the trading indicator.
Note: Cryptosignals.org is not a financial advisor. Do your research before investing your funds in any financial asset or presented product or event. We are not responsible for your investing results.
You can purchase crypto coins here. Buy Tokens