Bitcoin (BTC/USD) Strives Averaging $35,000 Level
Estimated Reading Time: 3 minutes
Don’t invest unless you’re prepared to lose all the money you invest. This is a high-risk investment and you are unlikely to be protected if something goes wrong. Take 2 minutes to learn more
Bitcoin Price Prediction – June 24
The trade worth of BTC/USD has been on a motion striving to average the level of $35,000 while it couldn’t dip further sustainable below the critical support baseline drew around the line of $30,000. The crypto’s point now strives to trade around the level of $34,005 at a percentage rate of about 1.95.
BTC/USD Market
Key Levels:
Resistance levels: $37,500, $42,500, $47,500
Support levels: $30,000, $27,500, $25,000
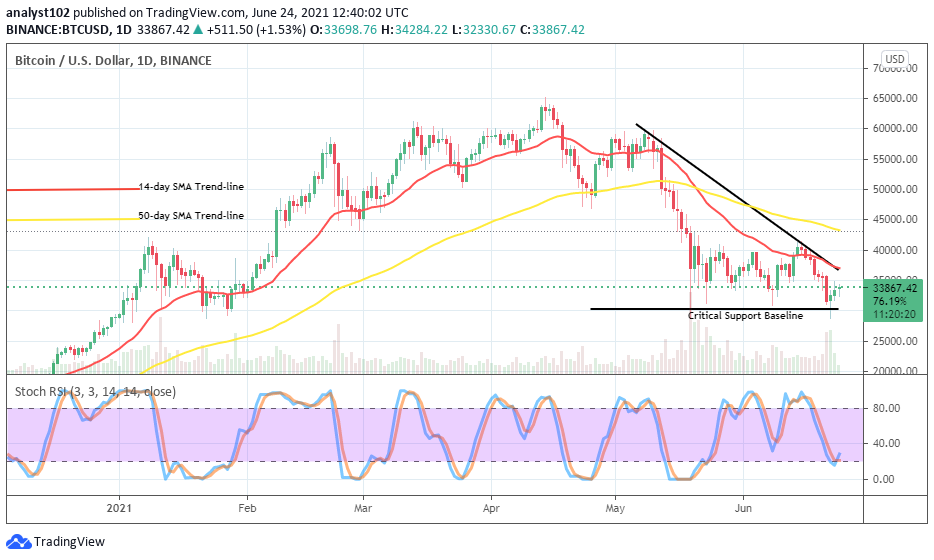
BTC/USD – Daily Chart
As it is shown on the BTC/USD daily chart, the market level at $30,000 has again been retained as the critical support baseline in determining the depth that some decent upswings are being made. After a notable bearish candlestick that emerged on June 21, a rebound was made from the below of critical support baseline. The 14-day SMA trend-line and the bearish trend-line are now conjoined above the current trading spot underneath the 50-day SMA indicator. The Stochastic Oscillators have crossed the lines northbound at range 20 to denote an ongoing upward force in the trade.
Could it be now that the crypto has regained momentum to surge sustainably northward?
As of writing, the BTC/USD market’s pressures to the upside are featuring in a very low key making the furtherance of upward moves dicey especially, to think of breaking past the immediate level of $37,500 in the near time. But, in the meantime, the level around the $30,000 has been reasonably somewhat made reliable for probably observing the last point at which some of the recent downward forces are tended to achieve in any worst scenario.
As regards the prolongation of this market’s downside, price may have to push upward for a slight test of a resistance point around the level of $37,500. If the market stays longer around that level, a loss of strength to the south may in no time come on. Meanwhile, in the absence of volatile moves, the crypto economy may tend to expose to other range-bound zones most possibly around the values of $35,000 and $30,000.
BTC/USD 4-hour Chart
The BTC/USD 4-hour chart reveals that in the last sessions, precisely, during June 22 sessions, price went downside to average lower support of $28,000. Shortly, a rally featured pushing the market northward to touch the spot where the smaller SMA and the bearish trend-line have met. The 50-day SMA indicator is located over the 14-day SMA trend-line. The Stochastic Oscillators are in the overbought region slightly pointing to the northbound. That suggests that some upward moves are presently in the featuring.
Note: new.cryptosignals.org is not a financial advisor. Do your research before investing your funds in any financial asset or presented product or event. We are not responsible for your investing results.
You can purchase crypto coins here. Buy Tokens