Bitcoin (BTC/USD) Trade Continues Featuring in Ranges
Estimated Reading Time: 3 minutes
Don’t invest unless you’re prepared to lose all the money you invest. This is a high-risk investment and you are unlikely to be protected if something goes wrong. Take 2 minutes to learn more
Bitcoin Price Prediction – July 15
BTC/USD trade continues featuring in the long-kept range-bound zones of $35,000 and $30,000 to trade at the value of $32,843. The crypto’s percentage rate is around -1.51.
BTC/USD Market
Key Levels:
Resistance levels: $35,000, $40,000, $45,000
Support levels: $30,000, $27,500, $25,000
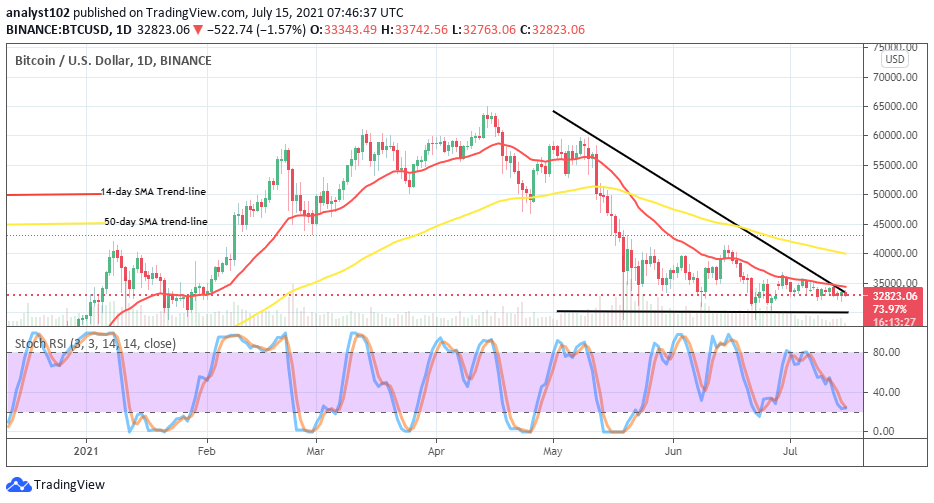
BTC/USD – Daily Chart
On the BTC/USD daily chart, the crypto trade continues featuring in the well-defined ranges with a slight downward force emanating beneath the smaller SMA. The bearish trend-line remains drawn southward across the trend lines of the two SMAs. The 14-day SMA indicator is underneath the 50-day SMA indicator as they still briefly bent to the south over the ranging spot of the crypto economy. The Stochastic Oscillators have closely headed toward the range of 20, suggesting that there may still be less motion in the present downward force.
Will a change of direction occur soon in the crypto economy as trade continues featuring in ranges?
As the BTC/USD trade continues featuring in ranges, it appears that the crypto economy may still go on until the other degrees of sessions. However, the market’s support level at $30,000 remains the critical baseline, also known as the lower range line of the ranging trend of the market. Bulls are to be on the lookout for when there will be a bullish candlestick signaling a probable end from a dip trading zone before considering rejoining the trade.
On the downside analysis of the market, the crypto market seems to be under falling pressure as there has been no successful break out of the upper range line at $35,000. Prolonged testing around the point earlier mentioned severally lead price into a falling motion that bears can take advantage of for profiteering. The crypto’s price may feature in a consolidation moving style around the lower level so that bears may be able to break it down in a probable short time.
BTC/USD 4-hour Chart
The BTC/USD medium-term chart shows that the crypto trade continues featuring in ranges near the lower value of $32,500. The Stochastic Oscillators are in the overbought region with their lines crossed southbound, indicating a downward directional movement. The 50-day SMA is above the 14-day SMA as they both point toward the east in the range-bound zones to back the current range trading situation of the BTC pairing with the US fiat currency. As of now, traders going for a long placing order of this crypto should stay away for a while until a bullish candlestick emerges to signal a stop to seeing further downs of the crypto trade at a lower point afterward.
Note: Cryptosignals.org is not a financial advisor. Do your research before investing your funds in any financial asset or presented product or event. We are not responsible for your investing results.
You can purchase crypto coins here. Buy Tokens