Bitcoin (BTC/USD) Trade Rallies Northward Slightly
Estimated Reading Time: 3 minutes
Don’t invest unless you’re prepared to lose all the money you invest. This is a high-risk investment and you are unlikely to be protected if something goes wrong. Take 2 minutes to learn more
Bitcoin Price Prediction – September 15
It has over a couple of days observed that the BTC/USD trade rallies northward slightly. The market trades at around the level of $48,066 at an increased rate of about 2.29 percent as of writing. It means that the crypto economy is currently striving to regain its lost momentum.
BTC/USD Market
Key Levels:
Resistance levels: $50,000, $52,500, $55,000
Support levels: $45,000, $42,500, $40,000,
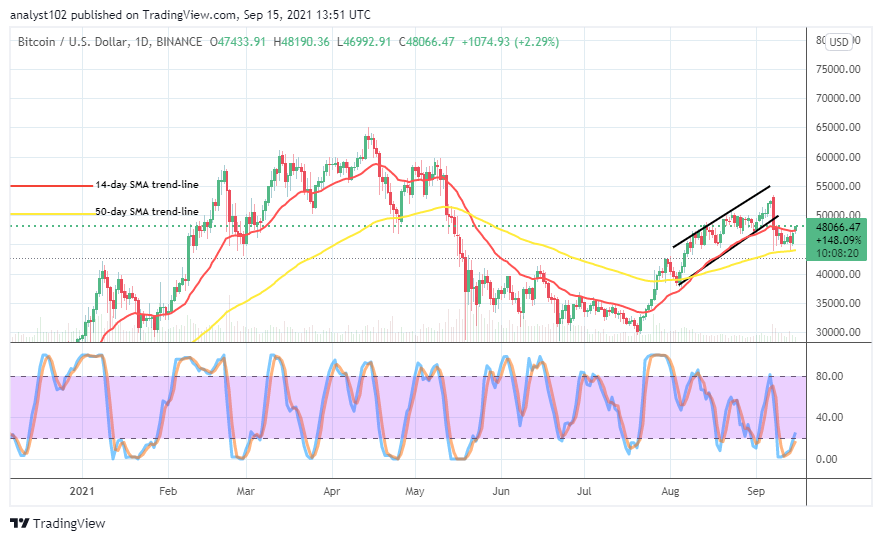
BTC/USD – Daily Chart
The BTC/USD daily chart has shown that the crypto trade rallies northward slightly from a lower trading zone of $45,000. Most of the candlesticks formed between September 10 and 14 trading days’ sessions bottomed on the value-line mentioned. Meanwhile, today’s candlestick presently witnesses its formation in the making, cutting the trend line of the smaller SMA to the north side in a slow-moving manner. The 50-day SMA is above the 14-day SMA as they are underneath the resistance line at $50,000. The Stochastic Oscillators have briefly crossed the lines northbound from the oversold region. That showcases that a sizeable upward pressure is going on presently.
Will there be stability in the present moves as the BTC/USD trade rallies northward slightly?
As the BTC/USD trade rallies northward slightly now, it is dicey to conclude that the crypto economy will enjoy stable motion to the upside. In the meantime, there have been series of slow price actions been featuring in the north direction. Observantly, there is no definite formation pattern in the last several hours to get entries. Nevertheless, the $50,000 market line stands to experience a pause if price continually pushing with the current low capacity.
On the downside, a sudden fearful price reversal motion needed to occur against some of the subsequent candlesticks that will form above the trend line of the smaller SMA before bears may consider staging a come-back. The signification of the Stochastic Oscillators that the market has embarked upon a rallying motion portends a warning against seeing reliable downward trading situations beneath the $45,000.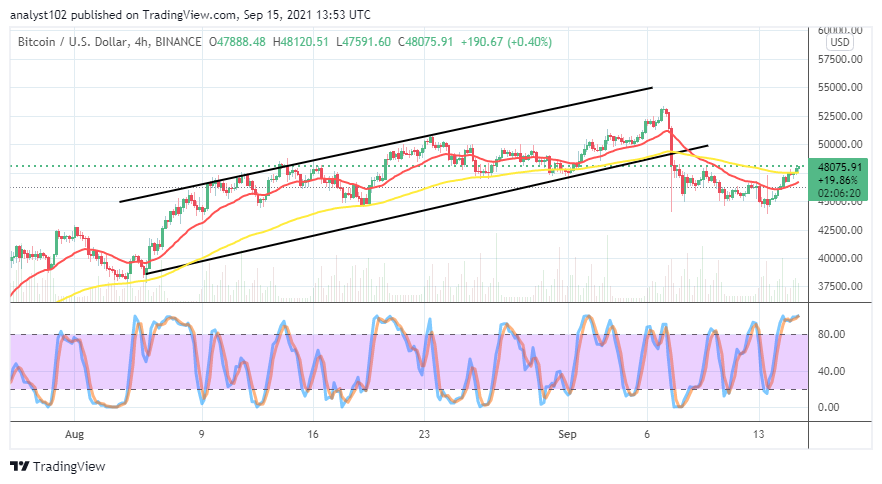
BTC/USD 4-hour Chart
The BTC/USD 4-hour chart showcases that the crypto trade rallies northward slightly. The 14-day SMA indicator has briefly bent northward beneath the 50-day SMA indicator. The Stochastic Oscillators are in the overbought region with the lines conjoined. Price has breached past $47,500 to the north side. That line is one of the main critical lines standing against uprises. A strong reversion against the point may result in taking the crypto-economic valuation to a lower line.
Note: Cryptosignals.org is not a financial advisor. Do your research before investing your funds in any financial asset or presented product or event. We are not responsible for your investing results.
You can purchase crypto coins here. Buy Tokens