Wall Street Memes (WSM) Trade Touches, Driving Ascendancy
Estimated Reading Time: 3 minutes
Don’t invest unless you’re prepared to lose all the money you invest. This is a high-risk investment and you are unlikely to be protected if something goes wrong. Take 2 minutes to learn more
Wall Street Memes Price Prediction – August 10
Bulls are now instinctively ready to make a strong comeback in the lower part of the WSM/USD market, as the current price is close to the baseline, driving ascendancy.
Buyers are naturally gearing up for a strong recovery in the WSM/USD market, gaining assurance from the market’s current stance near its foundational support level. This technical proximity is heightening buying momentum, inspiring renewed optimism, and strengthening expectations for a sustained upward trajectory over the coming sessions.
WSM/USD Market
Key Levels
Resistance levels: $0.0008, $0.0009, $0.001
Support levels: $0.0005, $0.0004, $0.0003
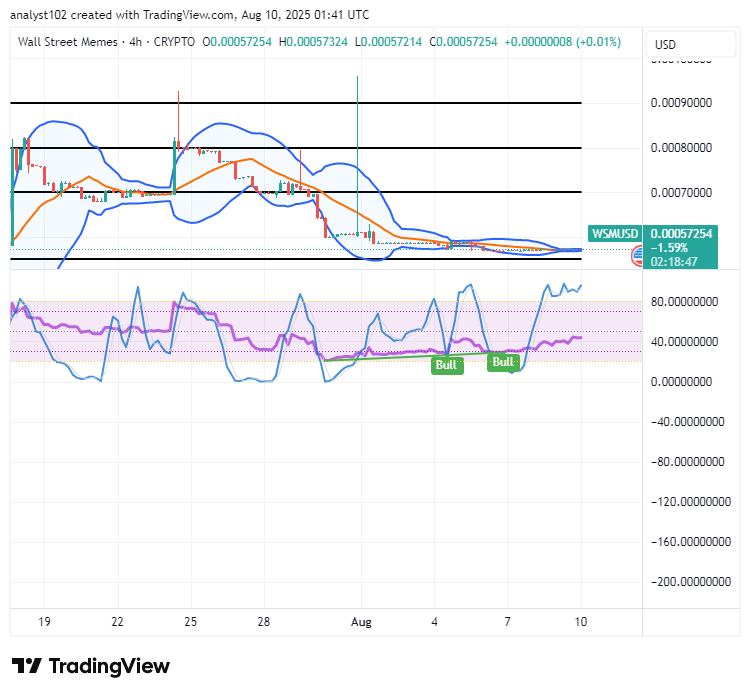
WSM/USD – 4-hour Chart
The medium-term chart of the WSM/USD depicts that the crypto-economic trade touches the baseline, driving ascendancy.
The stochastic oscillators persist in the overbought territory, underscoring that buyers continue to face challenges in decisively breaching established overhead resistance, despite modest bullish pushes. Meanwhile, the Bollinger Bands remain narrowly aligned eastward, closely trailing just beneath the $0.0006 trade line.
Based on Medium-Term Oscillator Readings, Can WSM/USD Bulls Advance Decisively Without Additional Momentum?
Given the medium-term oscillator readings, WSM/USD bulls are likely to sustain upward pressure, limiting bearish influence and preventing significant downside moves without requiring substantial additional momentum buildup, as the price touches the basis and drives ascendancy.
Long-term purchasers can maintain firm confidence as sustained bullish pressure remains intact despite limited new momentum inflows. Bearish influence is being consistently and strongly suppressed, keeping downside risks at a higher rate of possible containment.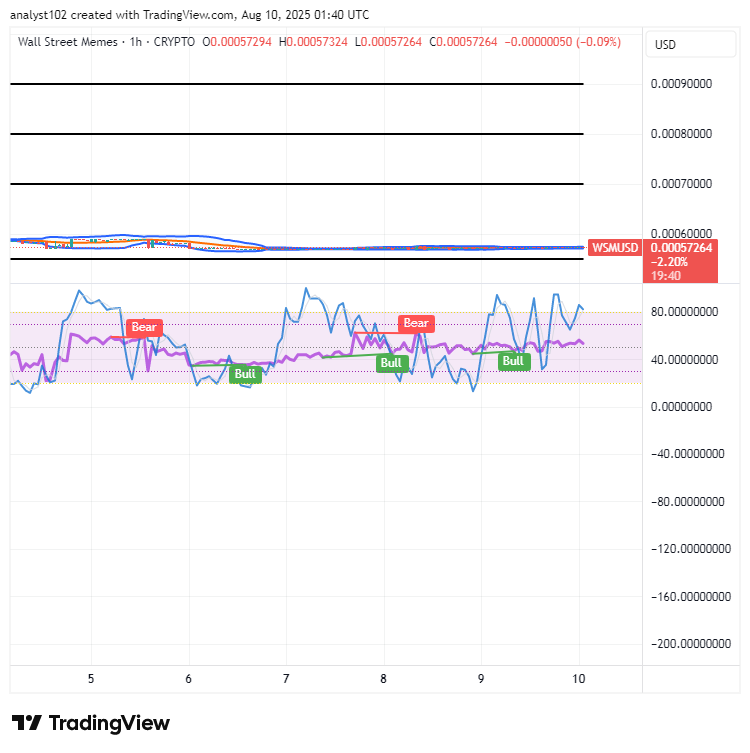
WSM/USD 1-hour chart
The 1-hour chart of the WSM/USD market touches the baseline, driving ascendancy in its moving outlook.
The stochastic oscillators are grossly skewed northbound, persistently swinging through the overbought region and several critical points around the 80 mark. The trend lines of the Bollinger Bands remain closely stretched eastward, clearly highlighting the sustained validity of the prevailing sideways price momentum alongside persistently reduced volatility levels.
BIGTIMEUSDT and WSMUSDT perpetual contracts are now listed on Bybit, offering traders expanded market access with adjustable leverage from 1x to 25x. These pairs are also integrated into Bybit’s Futures Grid Bot for automated strategy execution.
🚀 BIGTIMEUSDT & WSMUSDT Contracts now on Bybit!
— Bybit (@Bybit_Official) October 12, 2023
Dive into new trading opportunities with 1-25x leverage. Plus, they’re now on Bybit Futures Grid Bot! Start trading now.
📈 BIGTIME: https://t.co/FAQlbhnzAh
📈 WSM: https://t.co/pb2y2AfMBE#CryptoTrading #Bybit