Bitcoin (BTC/USD) Trade Reaches a New All-time Higher Level
Estimated Reading Time: 3 minutes
Don’t invest unless you’re prepared to lose all the money you invest. This is a high-risk investment and you are unlikely to be protected if something goes wrong. Take 2 minutes to learn more
Bitcoin Price Prediction – October 20
The BTC/USD trade has pushed northward vigorously to reach a new all-time higher level. The crypto-economic price trades around $66,693 at a percentage rate of about 4.15, briefly surpassing the last peak value point achieved during the April 14th session. That shows that the crypto market is waxing stronger this around to the moon side.
BTC/USD Market
Key Levels:
Resistance levels: $67,500, $70,000, $72,500
Support levels: $62,500, $60,000, $57,500
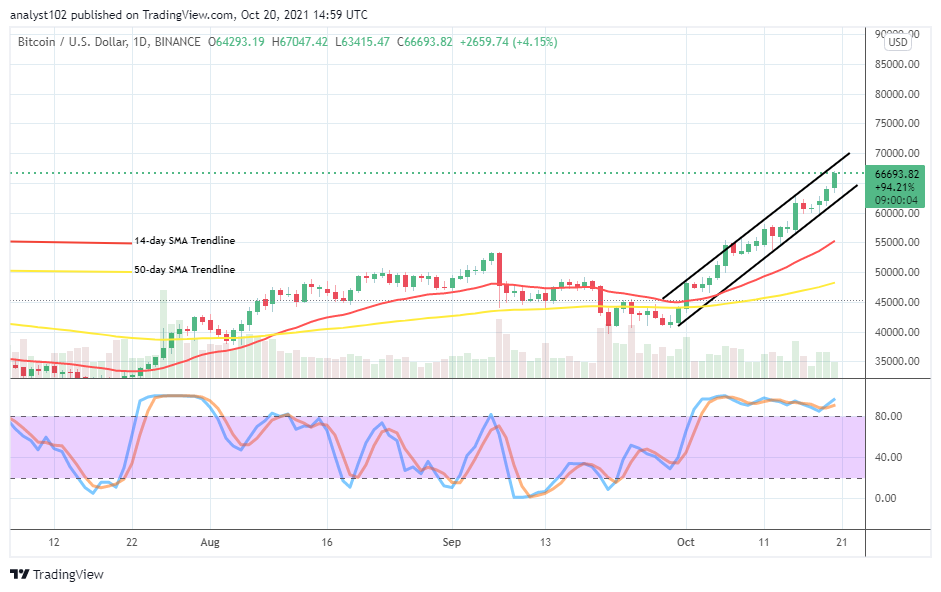
BTC/USD – Daily Chart
The BTC/USD daily chart reveals that the crypto-economic trade reaches a new all-time higher level. A bullish candlestick is in the making, averaging the resistance at $67,500. The bullish channel trend lines have extended northward to observe the upside path that price maintains. The SMAs are far underneath the bullish trend lines as the 14-day SMA indicator is above the 50-day SMA trend line. The Stochastic Oscillators are in the overbought region with conjoined lines, consolidating in it toward the northbound. That showcases that the crypto economy is adding more pressures to the upside.
When should traders expect a downward motion or retracements in the BTC/USD market operations as the crypto trade reaches a new all-time higher level?
A lot of patience will have to exercise to get a downward motion returning or retracement in the BTC/USD market operations more so that the trade reaches a new all-time higher level, slightly surpassing the previous point. The market level at $62,500 is currently considered the pivotal line if a breakdown against it could pose a warning signal to stop placing long positions. In the meantime, the price has to encounter some rejections or resistances at higher trading zones before a lower immediate support level can breach southward at the expense of buyers’ weaknesses.
On the downside, as it is earlier on envisaged, patients have to exercise before considering shorting positions. And the assumption remains for a while. Variant price rejections would have to occur at higher trading zones before considering re-launches of the sell order. Sellers needed to back up their entries with valid active price action.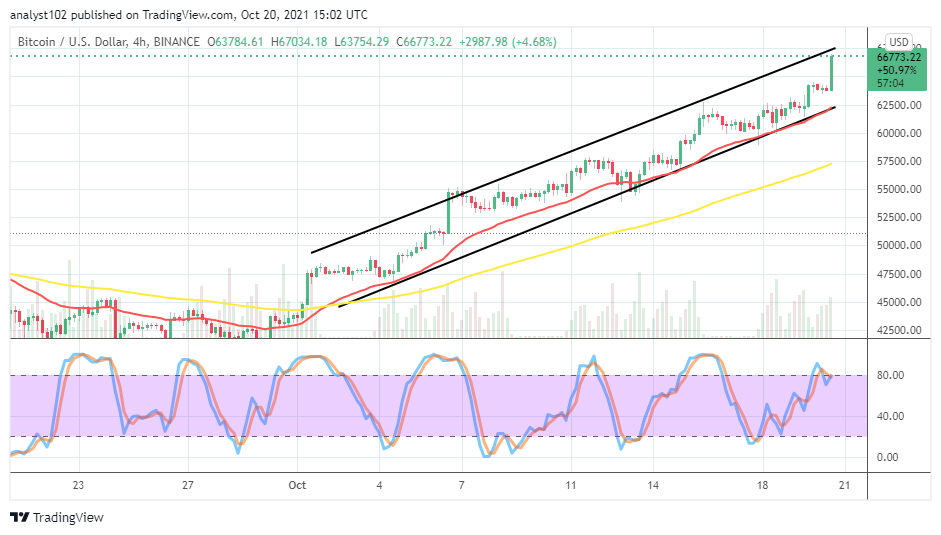
BTC/USD 4-hour Chart
The BTC/USD 4-hour chart showcases that the crypto-economic trade reaches a new all-time higher level as it keeps the bullish channel trend lines elongated above the SMAs. The lower bullish channel trend line drew alongside the smaller SMA. The 50-day SMA indicator is underneath the 14-day SMA indicator. The Stochastic Oscillators have erratically kept moving northbound across variant range value-lines until the range of 80. And they still point slightly to the north at the range line. That shows that the crypto economy’s movements to the upside may still push further against the valuation of the US currency.
Note: Cryptosignals.org is not a financial advisor. Do your research before investing your funds in any financial asset or presented product or event. We are not responsible for your investing results.
You can purchase crypto coins here. Buy Tokens