Solana (SOL) Price Prediction: SOL/USDT Sees a Strong Pullback
Estimated Reading Time: 3 minutes
Don’t invest unless you’re prepared to lose all the money you invest. This is a high-risk investment and you are unlikely to be protected if something goes wrong. Take 2 minutes to learn more
Date: June 6, 2025
The Solana token had recently approached the $190 price level. However, its price action has since retraced, falling to lower support levels. Although the $145 price level appears to have provided some support against bearish activity, let’s take a closer look at the technical outlook below.
SOL/USDT Long-Term Trend: Bearish (Daily Chart)
Key Price Levels:
Resistance: $150, $160, $170
Support: $140, $130, $120
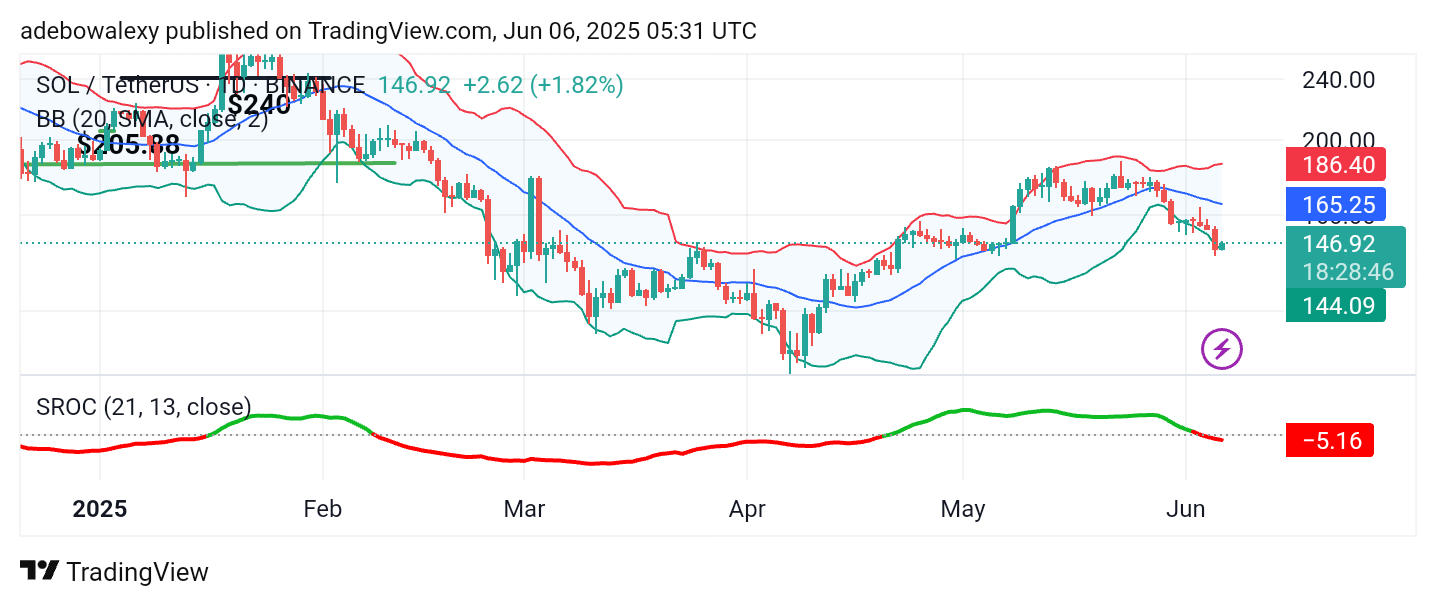
Price activity on the Solana daily chart appears to be trending downward. The price action recently tested support around the $146 level, and the ongoing session has responded with a slight upward rebound. The most recent candle is a small green candle positioned close to the lower limit of the Bollinger Bands. Similarly, the Smoothed Rate of Change (SROC) indicator lines continue to decline and have recently fallen below the equilibrium level. The end of the indicator line is now red, indicating a sustained increase in bearish momentum.
Solana (SOL) Price Prediction: SOL/USDT May Proceed Lower
The current daily session shows minimal price movement, reflecting a market still dominated by bearish sentiment. Price action remains below the lower limit of the Bollinger Bands, which suggests that downward pressure is still in control.
Consequently, the SROC indicator maintains a downward trajectory. Its terminal point is below the equilibrium line and remains red, signaling that bearish sentiment may continue to strengthen soon.
Solana (SOL) Price Prediction: SOL/USDT Approaches the $147 Mark
Price action on the 4-hour Solana chart suggests that market participants may be aiming for short-term gains. The last two candles appear bullish, with the most recent one still green at the time of writing. However, the candle appears compressed, which may indicate weakening bullish momentum and a potential return of selling pressure.
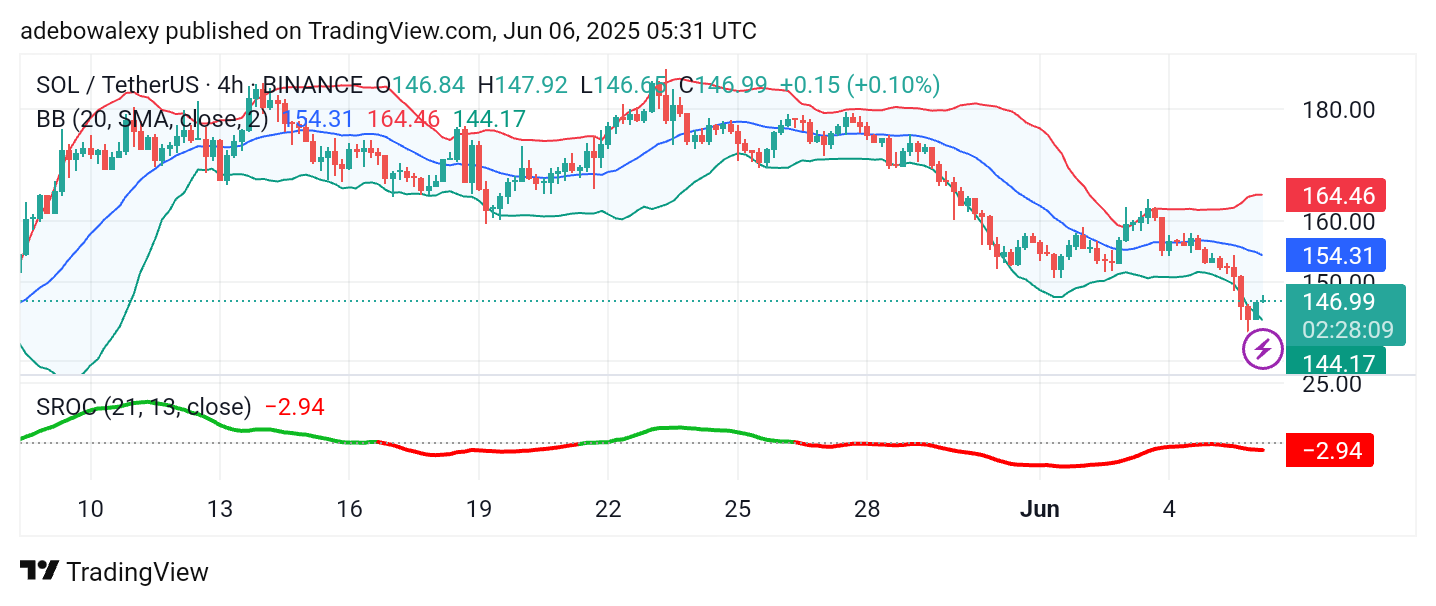
That said, the candle remains above the lower limit of the Bollinger Bands. The SROC indicator lines remain below the equilibrium level and move sideways. Meanwhile, the Bollinger Bands are noticeably dilated and slightly tilted downward.
Therefore, traders are advised to target nearby resistance levels—such as $150—until price action breaks above the middle Bollinger Band with stronger confirmation.