(Bitcoin) BTC/USD Trades Again Around the Key $60,000 Resistance Mark-Up
Estimated Reading Time: 3 minutes
Don’t invest unless you’re prepared to lose all the money you invest. This is a high-risk investment and you are unlikely to be protected if something goes wrong. Take 2 minutes to learn more
Bitcoin Price Prediction – April 3
It now equally observed that the market valuation of BTC/USD once again trades around the main resistance value of $60,000 as it did feature between March 13 and 20 trading days’ sessions.
BTC/USD Market
Key Levels:
Resistance levels: $65,000, $70,000, $75,000
Support levels: $50,000, $45,000, $40,000
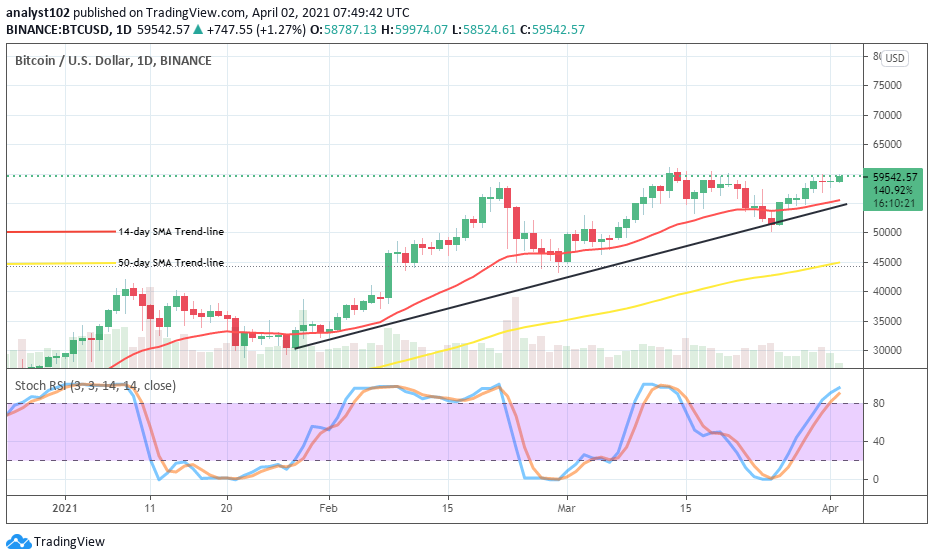
BTC/USD – Daily Chart
It is now been depicted by the BTC/USD daily trading chart that a full-fledged reversal pattern has almost been exhausted as price once again trades around the previous key resistance zone of $60,000. A small bullish candlestick appears to be in the formation over the SMA trend-lines. The 14-day SMA trading indicator is located above the 50-day SMA trend-line with a visible gap between them as they point towards the north direction. The Stochastic Oscillators are into the overbought region with a promising outlook of changing to a consolidation moving mode soon. Should that assumption comes to be, there will suggest a long stance of the BTC/USD bulls in the crypto-economy.
Will BTC/USD market this time around surge sustainably past the $60,000 value?
From the viewing of the point of technical trading approach, the market is poised to seeing a line of price reversal around the previous resistance area of $60,000 level in a near session. The said resistance trading zone now appears to be a critical high value that only left-over buying pressures tend to push the crypto’s away for a short period of trading. Therefore, buyers need to wary of launching their positions after that key resistance point to avoid getting whipsawed.
On the flip side, as it has been established that most crypto-markets are now in a bullish-dominating trend, and as this currency-pair takes a lead, the bears have been enjoined to always await a tangible signal denoting loss of momentum on the part of bulls before considering a sell order. And, such a sell position has to be backed up with active price action from a peak value.
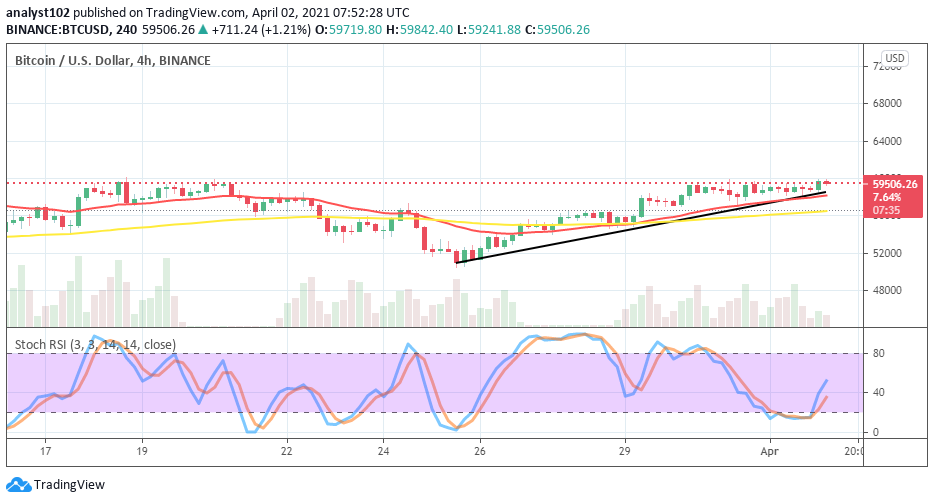
BTC/USD 4-hour Chart
There have been series of short bullish candlesticks signifying a relatively increasing outlook on the BTC/USD 4-hour trading chart. The crypto’s point initially went down briefly to locate support around a low level of $52,000 to now trade around a high value of $60,000 line. All the trend-lines are closely situated underneath the current trading point of the crypto-economy. The 50-day SMA is below the 14-day SMA as they both point towards the north. The Stochastic Oscillators have crossed the hairs between range 20 and 40 to point towards the northbound. That suggests the potential that more ups are still in the offing.
Note: cryptosignals.org is not a financial advisor. Do your research before investing your funds in any financial asset or presented product or event. We are not responsible for your investing