Uniswap Price Prediction: UNI Remains Under Bearish Pressure
Estimated Reading Time: 3 minutes
Don’t invest unless you’re prepared to lose all the money you invest. This is a high-risk investment and you are unlikely to be protected if something goes wrong. Take 2 minutes to learn more

Uniswap (UNI) Price Prediction: May 1
The behavior of price action in the Uniswap daily market suggests that the token’s price may descend towards lower levels. The prevalent bearish trend is quite strong, as trading indicators suggest that downward forces are holding sway.
UNI/USD Long-term Trend: Bearish (Daily Chart)
Key Levels:
Resistance Levels: $6.809, $8.000, and $10.00
Support Levels: $5.000, $3.000, and $1.00
Uniswap Price Prediction: UNI/USDT Eyes the $6.00 Mark
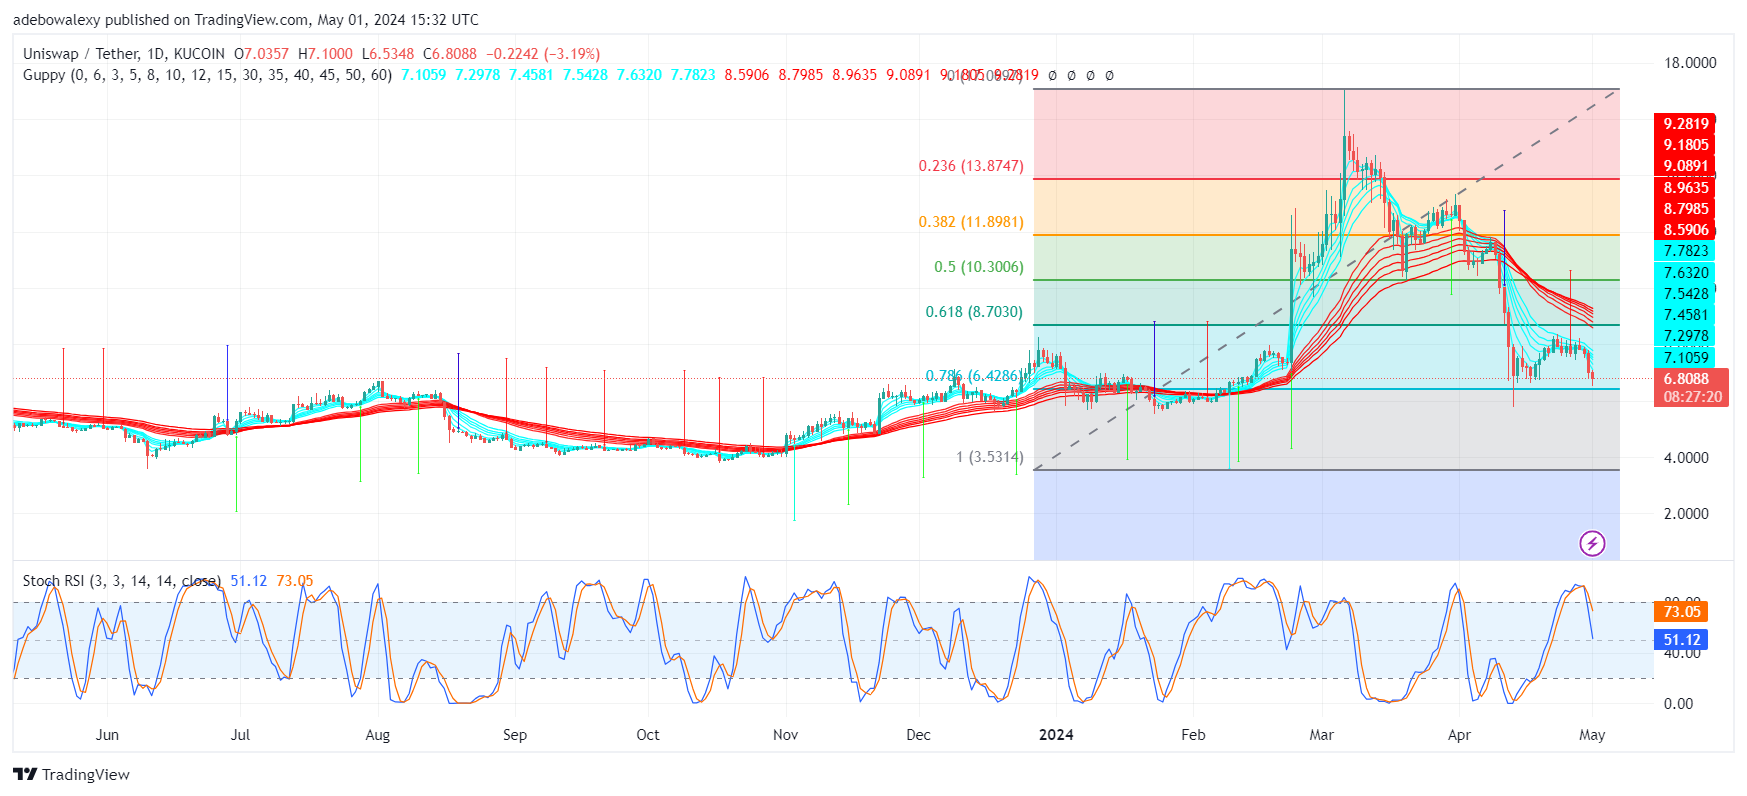
UNIUSDT: Daily Chart
Price activity in the UNIUSDT daily chart seems to have resumed the downward trend. This started after the market attempted to surpass the green Guppy Multiple Moving Average (GMMA) line with minimal momentum, as suggested by the size of the price candles. Price action consolidated for a while around the $7.00 mark but soon resumed a decisive downward correction below the green GMMA lines over the past three sessions. Meanwhile, the Stochastic Relative Strength Index (SRSI) lines are falling towards the 50 mark of the indicator.
Uniswap Price Prediction: Where is Price Action Heading in the UNISWAP Market?
Considering the momentum with which Uniswap price fell towards lower levels and the way bears have retained control in the ongoing session, this market may see yet more price declines. The current session stays bearish, even though the appearance of a lower shadow suggests that market forces are trying to stage a resistance.
Be that as it may, the perceived staged resistance still seems quite weak considering the terrain where trading activities are now occurring. At this point, it’s easy for more headwinds to set in and drive the market towards lower support levels.
UNI/USD Medium-term Trend: Upside Correction (4-H Chart)
Nevertheless, it appears that the market may resume a forward correction towards the $6.00 mark. This is because the token is still trading clearly below most of the GMMA indicator lines. Also, the SRSI indicator lines have delivered a crossover, which has no direction at the moment. The last two green price candles on this chart are quite small, thereby posting only minimal gains that haven’t moved the market significantly.
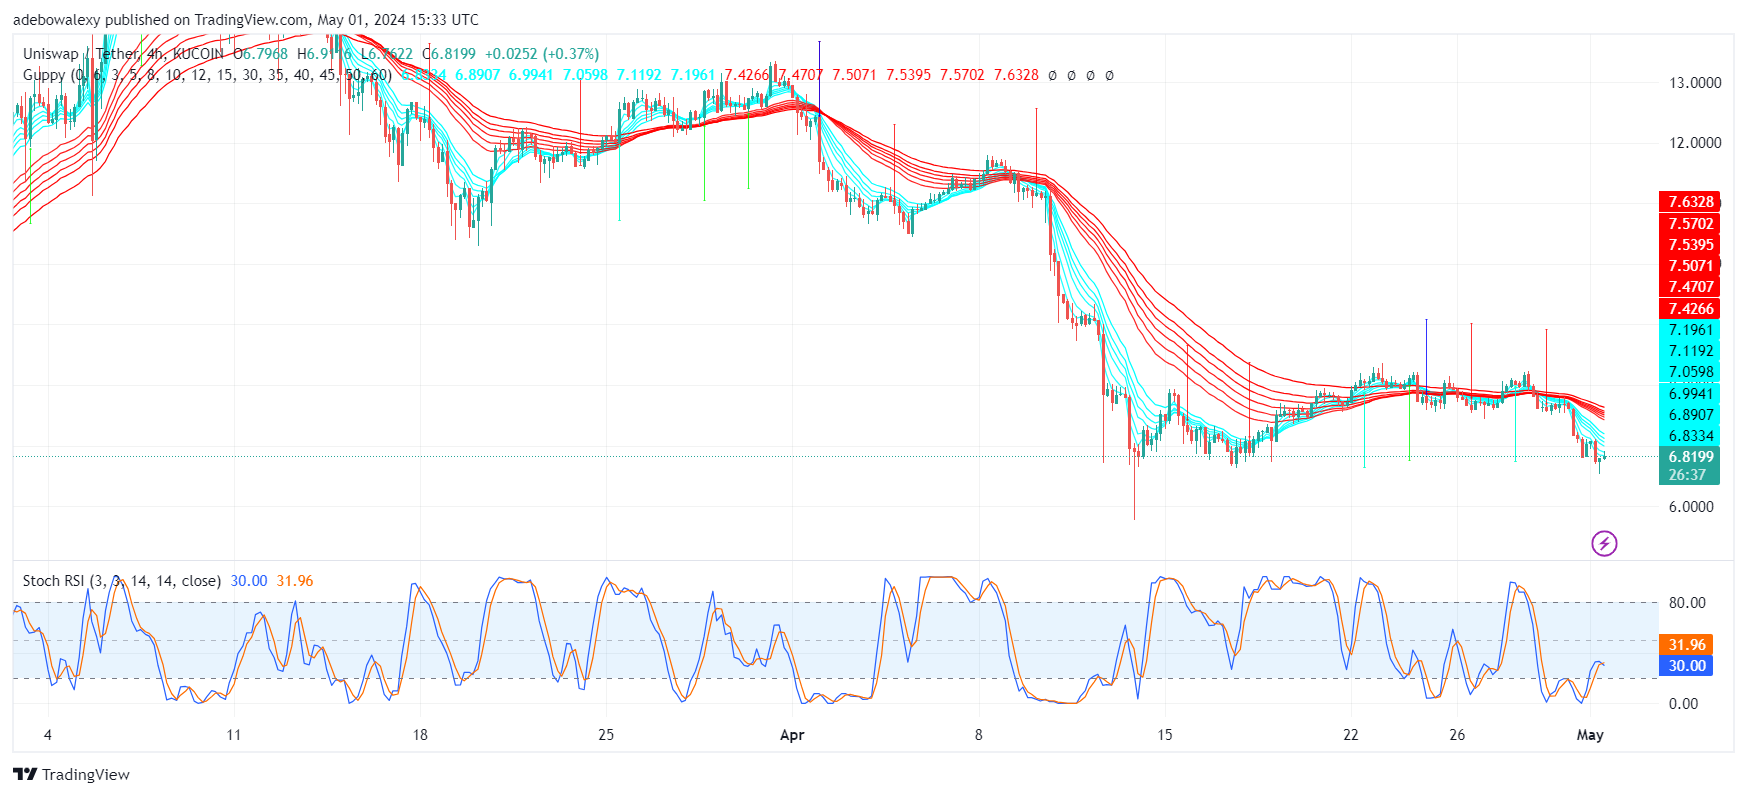
Considering the prevalent trend in the market, the market is showing that downward forces are still generally in control even in the 4-hour market. Therefore, it’s more reasonable to anticipate that the market may resume a downward correction towards the $6.00 mark based on indications arising from trading indicators in this market.